


In recent years, the potential importance of carbohydrate type in healthy diets has been repeatedly emphasised(1, Reference Mann, Cummings and Englyst2). The effects of different carbohydrate fractions, such as fibre, starch and sugars, as well as dietary glycaemic index (GI) and the glycaemic load (GL) on various health outcomes have been increasingly studied(Reference Barclay, Petocz and McMillan-Price3–Reference Jakobsen, Dethlefsen and Joensen5). The validity of dietary assessment methods in measuring different carbohydrate fractions beyond total carbohydrate and dietary fibre, however, seems to be poorly documented. For instance, FFQ validation studies have rarely included results for several carbohydrate fraction intakes, dietary GI and the GL(Reference Barclay, Flood and Brand-Miller6–Reference Pietinen, Hartman and Haapa11).
Due to feasibility and low cost, FFQ are widely used in large-scale epidemiological studies(Reference Willett12). FFQ validity testing is required to picture FFQ performance and shortcomings in measuring usual intake and ranking of subjects accordingly, which generally represents the main purpose of FFQ, including the one used in the present study. Food records (FR) are recommended as the self-reported reference method for FFQ validations and they remain commonly utilised(Reference Bingham, Cassidy and Cole13–Reference Molag, de Vries and Ocké15). In general, FFQ validation studies using FR as the reference method produce acceptable results(Reference Männistö, Virtanen and Mikkonen10, Reference Pietinen, Hartman and Haapa11, Reference Willett, Sampson and Stampfer16).
Personal characteristics of study subjects have long been supposed to affect FFQ validity(Reference Block and Hartman17). In spite of this, little documentation exists on how personal characteristics other than sex affect FFQ performance in adult populations. In one Australian study using 12 d weighed FR as the reference, it has been shown that age, BMI and medical condition, but not school-leaving age, were associated with the relative FFQ validity for some nutrients, including total carbohydrate, fibre, starch and sugars(Reference Marks, Hughes and van der Pols9). In an earlier Finnish study, a slightly weaker FFQ validity among younger women (30–50 years) and overweight men and women emerged when comparing FFQ estimates with 3 d FR(Reference Paalanen, Männistö and Virtanen18). However, no difference in correlations between high- and low-educated Midwestern Americans has been found when comparing FFQ estimates with those derived from 2 to 8 d FR(Reference Longnecker, Lissner and Holden19).
The aim of the present study was to evaluate the validity of an FFQ relative to FR among Finnish adults participating in a large population-based survey focusing on the intake of various carbohydrate fractions, dietary GI and the GL. Furthermore, the aim was to explore whether nutrient intake level and subject characteristics, such as age, education and BMI, are associated with the relative FFQ validity.
Methods
Selection of study subjects
The base population comprised the National FINRISK 2007 Study – the eighth population-based health survey conducted in 5-year intervals to monitor chronic diseases and their risk factors in Finland(Reference Vartiainen, Laatikainen and Peltonen20). The FINRISK 2007 sample (n 10 000, aged 25–74 years) was drawn randomly from the Finnish population register stratified by sex, 10-year age groups and five geographical areas. Of the invited subjects, 63 % participated in the health examination in January–March 2007.
Of the FINRISK sample, 33 % (n 3286) were randomised to a Finnish diet and nutrition monitoring survey (FINDIET 2007 Survey), in which, concurrently with the FINRISK health examinations, 2054 (63 %) subjects performed one 48 h dietary recall each(Reference Paturi, Tapanainen and Reinivuo21). Half of the interviewees (n 1039) received instructions to fill in one 3 d FR in January–March (n 935, returned) and a second 3 d FR in June–October 2007 (n 624, returned). All FR were entered using uniform coding decisions. Due to incompleteness and missing identification labels, 606 subjects completed two 3 d FR. Further exclusions were made due to FR classified as unreliable during the data entry (n 45) and illness affecting the diet (e.g. stomach flu) during food recording (n 6).
A second study visit of all FINRISK 2007 participants was conducted in April–June 2007 to gather detailed information on the dietary, lifestyle and genetic determinants of obesity and the metabolic syndrome (n 5024, 84 %). During this study visit, subjects filled in FFQ (n 4996) and other self-administered questionnaires, delivered blood samples and underwent anthropometric measurements. Trained study nurses checked the completed FFQ and a nutritionist entered the data. Exclusions were made due to incompletely filled FFQ (n 74) and daily energy intake cut-offs corresponding to 0·5 % at both ends of the daily energy intake distributions for men and women (n 48), resulting in 4874 FFQ.
A total number of 510 (218 men and 292 women) subjects had completed both the FFQ and two 3 d FR and formed the final population for the FFQ validation study. The administration sequence of the test and reference method featured two food-recording periods timed approximately 6 months apart (January–March and June–October 2007) and the FFQ administered in-between these periods (April–June 2007).
The study was conducted according to the guidelines laid down in the Declaration of Helsinki and the ethical guidelines of the National Institute for Health and Welfare. All procedures involving human subjects were approved by the Ethics Committee of the Hospital District of Helsinki and Uusimaa. Written informed consent was obtained from all subjects.
FFQ
The FFQ was an updated version of the one used in earlier studies of the National Institute for Health and Welfare, for instance the Health 2000 Survey(Reference Paalanen, Männistö and Virtanen18). The 48 h dietary recalls of the FINDIET 2007 Survey were used as the data source for the updates. These included a revision of the food list to reflect the continuously growing selection of available foods. For example, commonly eaten foods, such as grapes and milk puddings, were added. We also assigned fixed FFQ-item portion sizes separately for men and women based on self-reported usual portion size information derived from 48 h dietary recalls.
The updated 131-item FFQ was designed to measure the habitual diet over the previous 12 months. The FFQ items were presented in twelve food groups (e.g. milk products, cereal products and fruits). The subjects were asked to indicate the average consumption frequency of each FFQ item, with the nine frequency categories ranging from never or seldom to six or more times per d. The predefined FFQ-item portion sizes appeared as household and natural units (e.g. glass or slice) on the FFQ. The subjects were also able to report other frequently consumed foods not listed.
Food records
Subjects obtained face-to-face instruction on how to record everything they ate or drank during three consecutive days starting the day after the FINRISK health examination. To facilitate the estimation of portion sizes, a 170-item photographic picture booklet was provided(Reference Paturi, Nieminen and Reinivuo22). The second 3 d FR were mailed to those subjects who returned the first. Both 3 d FR were returned by mail to the National Institute for Health and Welfare.
Personal characteristics and anthropometric measures
Total years of education were inquired on a self-administered questionnaire and used to classify participants into three educational levels (low, middle and high) according to birth year. This was done to adjust for the extension of the basic education system and increase of average school years over time. Body weight was measured to the nearest 0·1 kg and height to the nearest 0·1 cm. BMI was calculated as weight (kg) divided by the square of height (m2).
Calculation of carbohydrate fraction intakes, dietary glycaemic index and the glycaemic load
Daily intakes were calculated using the Finnish National Food Composition Database (Fineli®)(Reference Reinivuo, Hirvonen and Ovaskainen23). The weights of the FFQ items as a daily average were obtained by multiplying the indicated frequencies of consumption by sex-specific fixed portion sizes. The Fineli® database contains GI values assigned for FFQ items and foods consumed by the FINDIET 2007 participants(Reference Kaartinen, Similä and Pakkala24). Thus, 100 % of the FFQ and FR items could be linked to a GI value. The methodology for the assignment of GI values to Finnish food items has previously been described(Reference Kaartinen, Similä and Pakkala24, Reference Similä, Valsta and Virtanen25). Dietary GI for both the FFQ and the FR were calculated as the weighted mean of the GI values of the carbohydrate-containing foods in the diet, where weighting is based on the proportion of the total carbohydrate content provided by each food(Reference Wolever, Jenkins and Jenkins26, Reference Wolever, Nguyen and Chiasson27). Dietary GL was calculated by multiplying the dietary GI value with the carbohydrate content of the diet and dividing by 100(Reference Salmerón, Ascherio and Rimm28, Reference Venn and Green29). Thus, the GL accounts for both the quality and quantity of the carbohydrates, and two diets with comparable GI can possess different GL due to largely different carbohydrate contents.
Statistical methods
All analyses were performed separately for men and women due to sex-specific portion sizes. Means and standard deviations of the selected subject characteristics (age and BMI) and educational-level proportions, as well as nutrient intakes, dietary GI and the GL from the FFQ and FR were calculated by sex. Nutrient intakes, dietary GI and the GL were log (natural)-transformed in order to satisfy the normality assumption and subsequently adjusted for each individual's energy intake by using the residual method(Reference Willett and Stampfer30). Each of the calculated residuals was added to the mean intake of the study population according to each dietary method. The food groups contributing most to the intake of total carbohydrate, carbohydrate fractions and the dietary GL were calculated.
The Spearman rank correlation coefficients between the FFQ and FR were calculated for all crude and energy-adjusted nutrients, dietary GI and the GL. The ability of the FFQ to rank subjects according to their intakes was assessed by categorising them by sex into quintiles of intake by the two methods. The proportion of subjects classified into the same or adjacent quintile and the opposite quintile (gross misclassification) by the two methods was calculated. Gross misclassification was defined as disagreement by four quintiles. The level of agreement in intake estimates between the two dietary methods was explored by calculating the mean ratios (FFQ/FR × 100) and corresponding 95 % CI of the energy-adjusted nutrient intakes, dietary GI and GL. Values greater than 100 % indicate that at the population level, the FFQ-based intake exceeds the FR-based intake, while the opposite holds true for values < 100 %.
Linear regression analysis was performed to investigate whether the difference in intake estimates (FFQ − FR, dependent variable) varied across the mean of intake estimates (FFQ+FR/2, independent variable), as suggested by Bland & Altman(Reference Bland and Altman31). The slope of the regression line was tested for a significant deviation from zero. The slopes significantly different from zero indicate a relationship between the level of intake and the measurement error in the FFQ relative to the FR. Linear regression analyses were also used to explore whether the difference between the methods was associated with each of the studied subject characteristics (age, education and BMI). All statistical analyses were performed using the SAS statistical software package version 8.2 (SAS Institute Inc., Cary, NC, USA).
Results
The participants' mean age was 55 and 52 years (range 25–74 years), and BMI was 27·2 and 26·7 kg/m2 for men and women, respectively. Of men, 36·5 % and of women, 36·7 % belonged to the highest educational group, while 27·2 and 30·4 % belonged to the lowest educational group, respectively. The means and standard deviations of the crude (unadjusted) daily nutrient intakes, dietary GI and the GL based on the FFQ and FR for men and women are given in Table 1.
Table 1 Daily nutrient intakes, dietary glycaemic index (GI) and the dietary glycaemic load (GL) based on the FFQ and two 3 d food records (FR) and corresponding between-method crude and energy-adjusted Spearman's rank correlation coefficients for men and women
(Mean values and standard deviations)

* Energy-adjusted using the residual method(Reference Willett and Stampfer30).
The same food groups explained over 90 % of the intake in each carbohydrate fraction and dietary GL in FFQ and FR. The relative contribution of the food groups differed, however, slightly between the methods. In general, milk products, fruits and berries, and juice contributed with greater percentages in the FFQ compared with FR, whereas in the latter, cereal products, sugar and confectionery, sugar-sweetened beverages, and alcoholic beverages received more emphasis.
The crude Spearman rank correlation coefficients (Table 1) ranged from 0·32 (dietary GI) to 0·68 (lactose) for men and from 0·16 (energy) to 0·67 (lactose) for women. The energy-adjusted correlations were between 0·27 (total sugars) and 0·70 (lactose) for men and between 0·37 (total sugars) and 0·69 (lactose) for women. Overall, nine out of eleven energy-adjusted dietary factors exceeded 0·40 in both sexes.
Based on the two methods, an average of 71 % (62 % for dietary GI to 81 % for lactose) for men and 65 % (58 % for energy and dietary GL to 81 % for lactose) for women were correctly classified in the same or adjacent quintile of crude intakes (see Appendix). The extent of correct classification was higher for the energy-adjusted intakes, on average 73 % for both men (62 % for total sugars to 83 % for lactose) and women (64 % for total sugars to 83 % for lactose). Gross misclassification was rare for the energy-adjusted dietary factors in both sexes: ≤ 6 % for men and ≤ 4 % for women.
As indicated by the mean ratios (FFQ % of FR), the FFQ consistently overestimated the energy-adjusted intakes of the nutrients and dietary GL in both sexes compared with the FR (Table 2). The most overestimated carbohydrate fractions were fructose and lactose. The Bland–Altman analysis revealed that a growing intake level in all of the studied dietary factors, except sucrose and the dietary GI, was associated with the between-method difference in women. In men, this phenomenon was observed for total carbohydrate, sugars, fructose, lactose, and dietary GI and GL. Figs. 1 and 2 provide examples of the Bland–Altman analysis (fructose and sucrose).
Table 2 Agreement in nutrient intakes, dietary glycaemic index (GI) and the glycaemic load (GL) between the FFQ and two 3 d food records (FR)
(Mean values, 95 % confidence intervals and regression coefficient)

*P < 0·05, **P < 0·01, ***P < 0·0001 (H 0: slope = 0, α = 0·05).
† The mean ratio of the two dietary methods at the population level and calculated as FFQ/FR × 100 with 95 % CI.
‡ Slope of the regression of the mean of the two methods, (FFQ+FR)/2, v. their difference, FFQ − FR (Bland & Altman(Reference Bland and Altman31)).
§ Energy-adjusted using the residual method(Reference Willett and Stampfer30).

Fig. 1 Bland–Altman plots(Reference Bland and Altman31) of fructose from the FFQ and two 3 d food records (FR) for (a) men (n 218; y = − 0·54× − 2·1, P < 0·0001) and (b) women (n 292; y = − 0·60× − 3·5, P < 0·0001). The linear trend (H0: slope = 0, α = 0·05) and the limits of agreement are indicated. Intake values are energy-adjusted using the residual method(Reference Willett and Stampfer30).

Fig. 2 Bland–Altman plots(Reference Bland and Altman31) of sucrose from the FFQ and two 3 d food records (FR) for (a) men (n 218; y = − 0·016×+9·2, P = 0·85) and (b) women (n 292; y = − 0·087×+3·3, P = 0·23). The linear trend (H0: slope = 0, α = 0·05) and the limits of agreement are indicated. Intake values are energy-adjusted using the residual method(Reference Willett and Stampfer30).
Age was associated with the absolute between-method difference in two out of eleven dietary factors in men (lactose and dietary GL; Table 3). In women, this was observed for all studied dietary factors, except starch, lactose and insoluble dietary fibre. In men, the belonging to the middle educational group (compared with the highest) was associated with the between-method difference in total and insoluble dietary fibre estimates. In women, associations emerged between the belonging to the lowest educational group (compared with the highest) and the between-method difference in total carbohydrate, starch, lactose and dietary GL estimates. BMI did not associate with the between-method difference in any of the studied dietary factors.
Table 3 Characteristics of study subjects associated with the difference in the energy-adjusted(Reference Willett and Stampfer30) intakes of nutrients, dietary glycaemic index (GI) and the dietary glycaemic load (GL) from the FFQ and two 3 d food records (FR) (FFQ−FR)
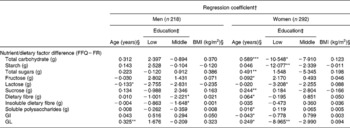
*P < 0·05; **P < 0·01; ***P < 0·0001.
† In cases where the mean of intake (FFQ+FR/2) was significantly associated with the difference (FFQ − FR), the mean was included in the model (Table 2).
‡ Reference: high education. Due to missing values, n 217 (for men) and n 289 (for women).
§ Continuous variable.
Discussion
The present Finnish FFQ validation study was conducted among a sample of 25–74-year-old men and women (n 510) participating in a large population-based survey (n 5024). In general, the 131-item FFQ overestimated carbohydrate fraction intakes and the dietary GL compared with the two 3 d FR. The ability of the FFQ to rank subjects according to relative nutrient intakes and dietary GI and GL is at an acceptable level and fairly comparable with other comprehensive FFQ used in large epidemiological studies(Reference Pietinen, Hartman and Haapa11, Reference Willett, Sampson and Stampfer16). The level of intake, subject age and, to a lesser extent, education, however, appear to be associated with FFQ performance for some dietary factors, especially in women.
In general, correlation coefficients are the most applied statistical procedures used to analyse the validity of FFQ(Reference Cade, Thompson and Burley14, Reference Serra-Majem, Frost Andersen and Henrique-Sanchez32). The present results for total carbohydrate and fibre compared reasonably well with those from classical validation studies(Reference Pietinen, Hartman and Haapa11, Reference Willett, Sampson and Stampfer16) and earlier studies from Finland(Reference Männistö, Virtanen and Mikkonen10, Reference Paalanen, Männistö and Virtanen18), showing correlation coefficients in the range of 0·42–0·64 for total carbohydrate and 0·51–0·73 for fibre. Moreover, subject classification into the same or adjacent quintiles was generally acceptable and gross misclassification was rare, which is relevant for the intended use of our FFQ.
Thus far, only a few large (n ≥ 100) validation studies have reported correlations between comprehensive FFQ and FR for carbohydrate fractions beyond total carbohydrate and fibre. Energy-adjusted Spearman's or Pearson's correlations for total starch (range 0·19–0·68) and sugars (range 0·39–0·63) have been reported in six studies each(Reference Barclay, Flood and Brand-Miller6–Reference Marks, Hughes and van der Pols9, Reference Pietinen, Hartman and Haapa11, Reference McKeown, Day and Welch33, Reference Riboli, Elmstahl and Saracci34). Correlations for sucrose intake ranging from 0·41 to 0·69 have been reported by one study from the USA(Reference Willett, Sampson and Stampfer16), one from Australia(Reference Barrett and Gibson7), two from Denmark(Reference Friis, Kruger Kjaer and Stripp35, Reference Tjønneland, Overvad and Haraldsdottir36) and three from Finland(Reference Männistö, Virtanen and Mikkonen10, Reference Pietinen, Hartman and Haapa11, Reference Paalanen, Männistö and Virtanen18). Only two studies have reported correlations for lactose intake (0·75 and 0·72)(Reference Barrett and Gibson7, Reference Männistö, Virtanen and Mikkonen10) and one for fructose intake (0·66)(Reference Barrett and Gibson7). The present findings compare reasonably well with the earlier ones for the different carbohydrate fractions. Only total sugars and fructose showed slightly lower correlations, which may in part originate from the different emphasis of the food groups as sources for sugars and fructose in the two methods.
Similar to different carbohydrate fractions, information on the validity of FFQ to measure dietary GI and GL has been scarce, since only five studies have been published using either FR comprising a total of 12–28 d or 12–24 h dietary recalls as the reference(Reference Barclay, Flood and Brand-Miller6, Reference Barrett and Gibson7, Reference Du, van der and van Bakel37–Reference Murakami, Sasaki and Takahashi39). In these studies, energy-adjusted correlation coefficients in the range of 0·40–0·69 for dietary GI and 0·32–0·70 for dietary GL have been reported. Thus, the correlations in the present study are in the lower boundary of these ranges. We observed an emphasis of medium- and high-GI foods (sugar and confectionery, soft drinks and alcoholic beverages) as carbohydrate sources in the FR compared with FFQ, whereas low-GI foods (milk products, fruits and vegetables) were emphasised in the latter. This divergence may in part contribute to the present results. Overall, possible reasons for the discrepancy across studies may relate to the variability of carbohydrate sources in populations and challenges in applying GI values to foods.
In general, variation in correlation results across studies may be due to population differences. A heterogeneous population, with regard to sex and age, can magnify between-person variation in diet and thus the correlations. Furthermore, comparing validation results is challenging, since the FFQ food lists differ in length. The number of FFQ items seems to be of importance, when exploring specific carbohydrate fractions and dietary GI and GL. Detailed questionnaires(Reference Pietinen, Hartman and Haapa11, Reference Riboli, Elmstahl and Saracci34) and questionnaires especially designed to measure carbohydrate intake(Reference Barrett and Gibson7, Reference Murakami, Sasaki and Takahashi39) have produced high correlations. However, FFQ with few items (e.g. < 100 items) show good validity for total carbohydrate, sucrose and fibre, even in populations restricted by sex and age(Reference Willett, Sampson and Stampfer16, Reference Friis, Kruger Kjaer and Stripp35, Reference Tjønneland, Overvad and Haraldsdottir36).
The number of food-recording days required to represent the usual diet, including carbohydrate intake, largely depends on the within-person variation in food consumption and nutrient intake(Reference Willett12). In general, higher correlations are observed, when the reference comprises several days(Reference Molag, de Vries and Ocké15). The earlier version of the present FFQ was validated against 3 d FR(Reference Paalanen, Männistö and Virtanen18). Compared with that study, we observed slightly better correlations for carbohydrate in both sexes, and sucrose and fibre in men. An earlier forerunner of our FFQ was validated against 14 d FR among 25–75-year-old women and showed poorer correlations for total carbohydrate and fibre than the present study, but better validity for lactose and sucrose(Reference Männistö, Virtanen and Mikkonen10). Thus, it seems that total carbohydrate and fibre intakes may be well covered with few recording days, whereas specific carbohydrate fractions require more.
The time sequence and the implementation order of the two methods can also affect between-method correlations. FFQ validation studies are conducted in a variety of different time sequences and variation in the number of consecutive FR days exists(Reference Willett12, Reference Molag, de Vries and Ocké15). This FFQ inquired about food consumption during the previous 12 months, and it was completed in-between the two food-recording periods, which formed the reference. Ideally, the FFQ should represent the time scale, during which the FR are kept(Reference Willett12). Unfortunately, this requirement was not completely fulfilled in the present study due to practical issues of the study protocol.
At the population level, FFQ commonly overestimate carbohydrate fraction intakes compared with FR(Reference Brunner, Stallone and Juneja8, Reference Pietinen, Hartman and Haapa11, Reference Paalanen, Männistö and Virtanen18, Reference Riboli, Elmstahl and Saracci34). This occurred also in the present study and might relate to general difficulties in self-reported dietary assessment. Bias may originate from the relative overestimation of foods (and related nutrients) perceived as socially desirable and energy (macronutrient) under-reporting. The latter consistently associates with higher BMI and other subject characteristics such as female sex and old age(Reference Poslusna, Ruprich and de Vries40). The extent to which energy under-reporting occurs is, however, likely to be population- and method-specific(Reference Maurer, Taren and Teixeira41). In estimated FR, the median prevalence of energy under-reporting is 30 %(Reference Poslusna, Ruprich and de Vries40). Thus, the observed overestimation of the FFQ may in part arise from under-reporting in FR, but the in-depth analysis of this is beyond the scope of the present study.
Age was associated with FFQ validity for most of the studied dietary factors in women, whereas in men, the effect of age was less prominent. This finding recurred in between-method correlation analyses performed in strata based on median age. Correlations for ≤ 57- and >57-year-old men differed only slightly, but appeared higher in ≤ 52-year-old women compared with >52-year-olds (data not shown). In contrast, Paalanen et al. (Reference Paalanen, Männistö and Virtanen18) found a poorer FFQ validity among young women (30–50 years) compared with older women (>50 years). Marks et al. (Reference Marks, Hughes and van der Pols9) did not observe an effect of age on FFQ validity in measuring carbohydrates in 25–75-year-old adults. Possible explanations for the present findings include that older age may undermine the subject's ability to diet reporting, which constitutes a demanding cognitive task(Reference McNeill, Winter and Jia42). General interest in health and food preparation can additionally predispose, especially women, to misreporting operating differently during the life course. The latter issue could also explain the few associations between education and FFQ validity evident in the present study. Earlier studies have, however, not shown such associations(Reference Marks, Hughes and van der Pols9, Reference Longnecker, Lissner and Holden19).
Earlier studies(Reference Marks, Hughes and van der Pols9, Reference Paalanen, Männistö and Virtanen18) have shown that BMI affects FFQ validity in measuring total carbohydrate, fibre and total sugars, but we did not. The present result remained as the linear regression analysis was repeated in age strata based on the median age cut-offs in both sexes. Additional between-method correlation analyses in median BMI-based strata revealed, however, that men in the lower BMI group ( < 27 kg/m2) had slightly higher correlations than overweight/obese men ( ≥ 27 kg/m2) (data not shown) similar to Paalanen et al. (Reference Paalanen, Männistö and Virtanen18). In women, the difference between normal weight ( < 25 kg/m2) and overweight/obese ( ≥ 25 kg/m2) did not appear prominently (data not shown). Regardless of BMI status in both sexes, correlations were acceptable and as in the present main analysis, lowest correlations in the overweight/obese men and women emerged for total sugars and dietary GI. This points towards a possible difficulty of overweight subjects to report certain food groups. The effect of this phenomenon on future studies cannot be ruled out.
Overall, reasons for the discrepancy of findings across studies relating to the effects of subject characteristics, including BMI, on FFQ validity are not well established. Given the small number of studies reporting these effects, more studies among different populations are needed. Most importantly, the effects are likely to be population- and FFQ-specific, further elucidating the need for FFQ validation studies and subsequent control for these factors in epidemiological analyses.
The present study is limited by the rather short time sequence of the FR, which may in part have led to the underestimation of FFQ validity. The similarity of consecutive FR days may hinder capturing the usual food consumption. Furthermore, the present study protocol did not allow for biomarkers reflecting carbohydrate fractions, such as the predictive biomarker for sugar intake(Reference Tasevska, Midthune and Potischman43). This precludes the investigation of the measurement error, which inevitably accompanies the FFQ among other dietary assessment methods(Reference Schatzkin, Subar and Moore44). Major strengths of the present study include the large sample size (n 510) compared with validation studies in general (median n 110)(Reference Cade, Thompson and Burley14). The subject distributions with regard to sex, age, education and BMI were similar to those of the entire study population (P values for differences 0·13, 0·28, 0·80 and 0·70, respectively, data not shown), suggesting good representativeness. The present study also reports results for several carbohydrate fractions and dietary GI and GL and effects of subject characteristics on the relative FFQ validity, adding to the scant body of knowledge in these research fields.
In conclusion, the present study provides evidence that the updated 131-item FFQ is a reasonably good tool for measuring the intake of macronutrients and several carbohydrate fractions, as well as dietary GI and GL in epidemiological studies, in which analyses are based on subject ranking. Furthermore, the present study suggests that among Finnish adults, especially women, the relative FFQ validity is associated with the level of intake, age and, to a lesser extent, education. These factors should be considered in future by executing careful statistical adjustments in diet–disease relationship analysis, but also by striving towards further developing the FFQ method.
Acknowledgements
This study was supported by the Academy of Finland (111420, 118065 and 136895), the Finnish Cultural Foundation, the Juho Vainio Foundation and the Yrjö Jahnsson Foundation. The authors declare no personal or financial conflict of interest. N. E. K., L. M. V. and S. M. contributed to the original conception of this work. N. E. K. performed the statistical analyses in cooperation with H. T. and K. H. M. E. S. and L. M. V. contributed to the assignment of GI values to foods, which was carried out by N. E. K. H. R. contributed to the FFQ modifications. T. K. performed the calculation of nutrient intakes and dietary GI and GL. S. M., L. M. V., J. G. E. and M. P. participated in the design of the Dietary, Lifestyle and Genetic determinants of Obesity and Metabolic syndrome (DILGOM) study. N. E. K. wrote the manuscript and all co-authors critically appraised the paper.
Appendix Cross-classification of crude and energy-adjusted nutrient, glycaemic index (GI) and glycaemic load (GL) distribution quintiles from the FFQ and two 3 d food records for men and women

† Disagreement by four quintiles (gross misclassification).
‡ Energy-adjusted using the residual method(Reference Willett and Stampfer30).


