


Dietary fibre exerts a number of beneficial effects on gastrointestinal (GI) health, and fibre consumption is associated with a reduced risk of colorectal cancer and other forms of chronic disease(Reference Aune, Chan and Lau1). Despite this, fibre intake in the USA is low, with most individuals consuming only half the recommended amounts(2).
Many of the potential health benefits are related to fermentation of fibre by gut bacteria. Fermentation leads to the production of SCFA, the most abundant of which are acetate, propionate and butyrate. While all SCFA have metabolic significance, butyrate is considered the most important for colonic health due to its effects on promoting normal colonocyte development. Additionally, SCFA production can lower luminal pH, which may inhibit growth of potentially pathogenic bacteria(Reference Topping and Clifton3). Fibre may also benefit laxation by increasing stool weight and improving stool consistency.
In recent years, the role of gut microbiota in human health has received increasing attention. While many studies have focused on the concept of prebiotics and the ability of fibre to alter levels of a few select bacterial species, there is now interest in assessing how diet influences the overall bacterial community. Terminal restriction fragment length polymorphism (TRFLP) analysis is a bacterial fingerprinting technique that provides a rapid overview of inter-individual differences in the gut microbial community (GMC). This technique has been used previously to identify changes in gut microbiota in response to dietary interventions(Reference Li, Hullar and Schwarz4).
Although fibre has many potential health benefits, increasing fibre in the diet can also lead to undesirable side effects such as gas and bloating. These symptoms may act as a deterrent for fibre intake. Tolerance is defined as a state in which there is an absence of unwanted symptoms related to fibre consumption(Reference Livesey5). It is of interest to identify fibres that can be added to food products without causing intolerance in order to increase overall fibre consumption.
While many Americans could benefit from increasing the amount of fibre in their diets, it is important to consider the type of fibre in order to balance tolerance and physiological benefits.
Functional fibres are constantly being developed by the food industry for use as ingredients in food products. However, little research is available regarding the effects of novel functional fibres on GI health. Resistant starch (RS), soluble maize fibre (SCF) and pullulan (P) are maize-based fibres that can easily be incorporated into foods or beverages. Previous studies have shown that these fibres are well fermented(Reference Maathuis, Hoffman and Evans6), but research regarding their physiological effects in vivo is limited. Therefore, the objective of the present study was to examine the influence of these fibres on laxation, GI tolerance, SCFA production and the GMC in healthy human subjects.
Experimental methods
Participants
A total of twenty participants (ten men and ten women) were recruited via flyers posted around the University of Minnesota campus. Participants were initially screened over the phone to determine eligibility for the study. Eligible participants were English-speaking, healthy men and women between 18 and 60 years of age, non-smoking, not taking medications, weight stable and had a BMI between 18·5 and 27 kg/m2. Participants were excluded if they had a history of cardiovascular, renal or hepatic disease, diabetes mellitus, GI conditions affecting digestion and absorption, were vegetarians or consumed more than approximately 15 g of fibre per d. Participants were not taking fibre supplements or laxatives and had not taken antibiotics for at least 6 months before the study. The present study was conducted according to the guidelines laid down in the Declaration of Helsinki, and all procedures involving human subjects were approved by the University of Minnesota Institutional Review Board Human Subjects Committee. Written informed consent was obtained from all subjects before any study procedures.
Study design
Before official enrolment, participants attended a screening visit at the University of Minnesota General Clinical Research Center (GCRC) to obtain informed consent, collect anthropometric measurements, verify medical history and receive study instructions and supplies. Eligible participants were instructed to follow a low-fibre ( ≤ 15 g), lead-in diet and to avoid fibre supplements, excessive exercise and alcohol for 24 h before the study visits. Participants were required to maintain their current activity level and were instructed not to initiate a weight-loss programme for the duration of the study. Before any dietary intervention, participants collected a baseline faecal sample while following their habitual diet. Baseline faecal samples were analysed using the same protocol as samples collected following intervention periods.
Participants consumed five treatments in a double-blind, cross-over design with treatment periods of 7 d followed by a 21 d washout period. On day 1 of the study, following a 12 h fast, participants arrived at the GCRC and consumed either a low-fibre control breakfast or one of four fibre-containing breakfasts. Meals consisted of a muffin, hot cereal, and fruit-flavoured beverage. For the next 6 d, participants consumed the study products at home. Treatments were provided as cereal bars and a beverage mix, which was pre-measured into 500 ml water bottles. Participants were instructed to consume four cereal bars and one beverage over the course of each day.
The test breakfast on day 1 supplied 25 g SCF or RS alone or in combination with 5 g pullulan (SCF+P and RS+P). The cereal bars and beverage contained the same fibre treatments, but at a slightly lower dose of 20 g supplemental fibre per d. All test products were provided by Tate and Lyle, Inc. The study products were matched for macronutrient and energy content, and were consumed along with the participants' habitual diets. The compositions of the control and fibre treatments are displayed in Table 1.
Table 1 Composition of the test meals*
SCF, soluble maize fibre; P, pullulan; RS, resistant starch.
* All data provided by Tate and Lyle, Inc.
† Values are the sum of the entire meal: 90 g muffin, 170 g hot cereal mix, 110 g whole milk and 240 ml beverage.
‡ Values are the sum of the study products for each day: 4·40 g cereal bars and 500 ml beverage.
SCF is produced via hydrolysis of maize starch, followed by cooling to form a branched structure. It has an average degree of polymerisation of 10. The RS used in the present study is classified as type 3 RS (RS3, retrograded starch) produced from heat moisture-treated, high-amylose maize starch. Pullulan is a linear glucose homopolysaccharide formed via the fermentation of dextrin by the yeast Aureobasidium pullulans. Resistance to degradation by human digestive enzymes is due to the presence of α-1,6 bonds, as well as to steric hindrance which limits access to α-1,4 linkages(Reference Kendall, Esfahani and Hoffman7). The control treatment was fully digestible maltodextrin. Treatment materials were analysed as dietary fibre by AOAC method 991.43 or AOAC method 2001.03. Dietary fibre analyses were provided by Tate and Lyle, Inc.
Stool records and tolerance
Before leaving the GCRC, participants were given instructions on completing a GI symptom questionnaire at 20.00 hours on days 1 and 6 of each study period. Subjects were instructed to consume all test products for the day before completing the questionnaire. The symptom questionnaire assessed stool frequency and consistency, as well as GI side effects. Symptoms included flatulence, bloating, abdominal cramps and stomach noises, and were rated on a ten-point scale, where 1 = none and 10 = excessive. Stool consistency was assessed on a scale of 1–4, where 1 = liquid and 4 = hard. Participants completed a daily record of study product consumption and were asked to return any uneaten study products to assess compliance. Participants were also instructed on the collection and delivery of a faecal sample on day 7 of each treatment period. Participants collected one fresh stool sample using the Commode Specimen Collection Kit (Sage Products) and sample collection bags provided by the study staff. Participants delivered samples to the GCRC on ice within 2 h of defecation.
Stool sample collection and bacteria DNA extraction
Immediately following the delivery of stool samples by participants, study staff collected two pea-sized samples of fresh faeces and added them to a tube containing 5 ml RNAlater (Ambion). The collection tube was inverted fifteen times, and samples were stored at − 80 °C. Frozen samples were shipped to the Fred Hutchinson Cancer Research Center for analysis. Faecal samples in RNAlater were homogenised using an OMNI tissue homogeniser (OMNI, Inc.) and aliquoted into 300 μl volumes. Faecal bacterial genomic DNA was extracted in duplicate using a QIAamp stool mini kit (Qiagen) with 1 min bead beating(Reference Li, Hullar and Lampe8).
Faecal chemistry and SCFA
Stool wet weight was determined in g by weighing the filled collection bag on a balance and subtracting the average bag weight. Stool consistency was determined subjectively by investigators and rated using King's Stool Chart(Reference Whelan, Judd and Taylor9). Faecal samples were homogenised with a hand blender and pH was determined in an aliquot using a glass electrode at 25 °C (Orion PerpHecT LogR Meter, model 350; Thermo Electron Corporation).
Acetate, propionate, butyrate and total SCFA were extracted in duplicate and concentrations were determined via GC using the method described by Schneider et al. (Reference Schneider, Girard-Pipau and Anty10), with minor modifications. Briefly, 200 mg of stool were suspended in 1·6 ml distilled water. Then, 2 ml diethyl either and 0·4 ml sulphuric acid (50 %) were added, along with 2 μl ethyl butyrate as the internal standard. Samples were mixed in an orbital shaker for 45 min and centrifuged at 3000 rpm for 5 min. The supernatant was transferred to a glass test-tube and residual water was absorbed using calcium chloride. Samples were filtered using a 1 ml syringe (Sherwood Medical) and a Fisherbrand nylon filter (13 mm, pore diameter 0·2 mm; Fisher Scientific), and frozen at − 80 °C until analysis via GC. Analysis was conducted using a Stabilwax DA column (30 m, 0·52 mm internal diameter, 1 μm film thickness; Restek) with He as the carrier gas.
Terminal restriction fragment length polymorphism
A TRFLP profile was generated for each extracted faecal bacterial genomic DNA sample using a protocol described previously, with minor modification(Reference Li, Hullar and Lampe8). Bacterial 16S ribosomal RNA genes were amplified with primers 11-27f and 519r (GWATTACCGCGGCGCTG). The forward primer is identical to 8-27f as described by Li et al. (Reference Li, Hullar and Lampe8) except that the initial 5′-AGA nucleotides were removed in order to reduce specificity and capture more GMC organisms(Reference Weisburg, Barns and Pelletier11).
Data analysis
SCFA concentrations, stool weight, stool pH, stool frequency and GI symptoms were compared among the treatments using a mixed-effects linear model with a random subject effect (Proc Mixed) using Statistical Analysis Systems statistical software package version 9.3 (SAS Institute). Carry-over and period × treatment interaction terms were tested in each model, but were excluded from the final models since they were not significant. Paired t tests were used to determine differences in GI symptoms between days 1 and 6. Data are presented as means with their standard errors, adjusted for study visit. Statistical significance was set at P< 0·05.
TRFLP profiles were analysed with DAx software (Van Mierlo Software Consultancy) as described previously(Reference Li, Hullar and Schwarz4). Non-metric multidimensional scaling ordination analysis was performed on the mean of duplicate P i values using PC-ORD (MJM Software Design)(Reference McCune and Grace12). Permutational multivariate ANOVA was used to test whether there was an effect of treatment on the composition of the GMC. All P values were corrected for multiple comparisons using Bonferroni adjustments where borderline significance was at P= 0·1/15 = 0·007 and significance at P= 0·05/15 = 0·0033.
To identify organisms (represented by TRFLP fragment length) that occurred uniquely in participants on different treatments, we performed indicator species analysis in PC-ORD (MJM Software Design). We linked the TRFLP fragment lengths of the indicator peaks with gut microbial taxonomic annotations. Our reference database consisted of archived human GMC sequences from the comprehensive SILVA 102 reference database of curated high-quality 16S ribosomal RNA gene sequences(Reference Pruesse, Quast and Knittel13) and approximately 30 000 sequences generated from ten individuals. We generated in silico terminal restriction fragments from each of the 67 506 reference sequences using the Alu I and Rsa I restriction endonuclease cut sites. Terminal restriction fragment sequences with lengths (bp) matching the two Rsa TRFLP indicator peaks (309 and 314 bp) ± 2 bp were collected.
Results
Participants
All the twenty participants who enrolled in the study completed all the five treatments. Mean age and BMI were 29 (sem 8) years and 23 (sem 2) kg/m2, respectively.
Stool characteristics
Stool characteristics are presented in Table 2. Stool weight and stool consistency (investigator-reported and subject-reported) did not differ among the treatments. The self-reported number of stools was greater on day 6 following the RS and RS+P treatments compared with the control (P= 0·0119) and SCF (P= 0·0257) treatments. Stool pH was significantly lower when participants consumed the SCF treatment compared with the control (P= 0·0472) and RS (P= 0·0457) treatments, while pH values for the SCF+P and RS+P treatments were intermediate. These pH differences were reflected in SCFA concentrations. Total SCFA were significantly higher for the SCF treatment compared with the RS (P= 0·005) and control (P= 0·007) treatments, but did not differ from the SCF+P or RS+P treatment. The percentage of acetate was higher for the SCF (P= 0·02), SCF+P (P= 0·03) and RS (P= 0·002) treatments compared with the control treatment. Both RS treatments resulted in a lower percentage of propionate compared with the control and SCF treatments (P< 0·0001). The percentage of butyrate was significantly higher than all the other treatments following the consumption of RS+P (P< 0·001), and was higher than both SCF treatments following the consumption of RS (P< 0·01).
Table 2 Stool pH, weight, number, consistency and SCFA concentrations of healthy adults consuming soluble maize fibre (SCF, 20 g/d) or resistant starch (RS, 20 g/d) alone or in combination with 5 g pullulan (SCF+P and RS+P) or no supplemental fibre (maltodextrin control) after 6–7 d of treatment (Mean values with their standard errors)
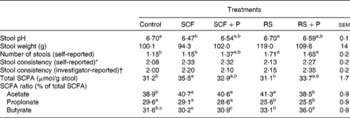
a,b,cMean values within a row with unlike superscript letters were significantly different (P< 0·05).
* Self-reported stool consistency on day 6 was rated on a four-point scale (1 = hard, 4 = diarrhoea).
† Investigator-reported stool consistency was rated on a four-point scale (1 = hard and formed; 2 = soft and formed; 3 = loose and unformed; 4 = liquid(9)).
Gastrointestinal symptoms
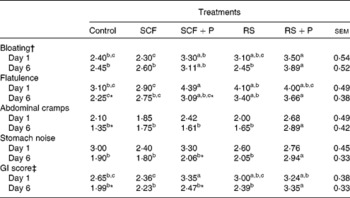
GI symptom ratings are reported in Table 3. On day 1, participants reported greater bloating following the consumption of the RS+P treatment compared with the control (P= 0·0263) and SCF (P= 0·0157) treatments. Flatulence was highest when participants consumed the SCF+P treatment compared with the control (P= 0·0271) and SCF (P= 0·0111) treatments, while the two RS treatments were intermediate. Abdominal cramps and stomach noise did not differ. The GI score for the SCF+P treatment was significantly greater than that for the SCF and control treatments. On day 6, the RS+P treatment caused greater bloating than the RS (P= 0·0045), SCF (P= 0·0105) and control treatments (P= 0·0045); greater flatulence than the SCF (P= 0·0452) and control (P= 0·0023) treatments; and greater abdominal cramps and stomach noise than all the other treatments. The GI score for the RS+P treatment was significantly greater than that for all the other treatments. When GI symptoms were statistically different between days 1 and 6, symptoms were always rated lower on day 6 (Table 3).
Table 3 Gastrointestinal (GI) tolerance ratings after consuming the test treatment on days 1 and 6 of each treatment period (Mean values with their standard errors)
SCF, soluble maize fibre; P, pullulan; RS, resistant starch.
a,b,cMean values within a row with unlike superscript letters were significantly different (P< 0·05).
* Within a GI symptom, scores for a treatment were significantly different between days 1 and 6 (P< 0·05).
† Symptoms were each rated on a ten-point scale (1 = none, 10 = excessive).
‡ The GI score is the mean of bloating, flatulence, abdominal cramps and stomach noise ratings (possible range 1–10).
Gut microbial community
Non-metric multidimensional scaling analysis explained 81 and 86 % of the total variation in the composition of the GMC using Alu I and Rsa I, respectively. In Fig. 1, SCF and SCF+P tend to cluster at the bottom of the cloud of samples. Permutational multivariate ANOVA showed that there was a significant effect of treatment on the GMC measured using Rsa I (P< 0·0006) but none using Alu I (P>0·05). The GMC associated with baseline was significantly different from the SCF (P< 0·001) and SCF+P (P< 0·001) treatments. Among the treatments, the control was significantly different from the SCF (P< 0·001) and SCF+P (P< 0·0002) treatments. The SCF treatment was significantly different from the RS treatment (P< 0·007), and the SCF+P treatment was significantly different from the RS+P treatment (P< 0·002). The GMC following the consumption of the SCF and SCF+P treatments was not significantly different from one another. The indicator species analysis showed that Rsa I peak 309 was significantly enriched after the SCF treatment (P< 0·0006) and Rsa I peak 314 was significantly enriched after the SCF+P treatment (P< 0·0014). Rsa I peak 309 was identified as either Anaerococcus vaginalis or Parabacteroides goldsteinii and Rsa I peak 314 was identified as either Parabacteroides distasonis or Parabacteroides merdae using an in silico TRFLP prediction program based on 16S ribosomal RNA sequences from the SILVA database and human reference samples.
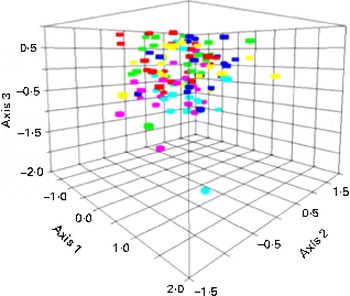
Fig. 1 Non-metric multidimensional scaling analysis of Rsa I terminal restriction fragment length polymorphism patterns of the 16S ribosomal RNA gene from the gut microbial community of the study participants on the different dietary interventions. Red, control; green, soluble maize fibre (SCF); light blue, SCF+pullulan (P); fuchsia, resistant starch (RS); dark blue, RS+P; yellow, baseline. (A colour version of this figure can be found online at journals.cambridge.org/bjn).
Discussion
Despite the relatively high dose of fibre provided in the present study, few changes in stool characteristics were observed. The reduction in stool pH following the consumption of SCF was minor (0·23 units), but was consistent with an earlier study in which participants consumed 21 g SCF/d for 3 weeks(Reference Boler, Serao and Bauer14). Walker et al. (Reference Walker, Duncan and McWilliam Leitch15) reported that a one-unit shift in pH had marked effects on bacterial populations and SCFA production in vitro. However, the clinical significance of smaller changes in pH has not been well studied. In contrast to the present study, Stewart et al. (Reference Stewart, Nikhanj and Timm16) found no differences in pH when participants consumed 12 g SCF/d, suggesting that a higher dose may be needed for an effect. Most studies have reported a minimal effect of RS on pH(Reference Stewart, Nikhanj and Timm16–Reference Cummings, Beatty and Kingman21).
Fibre can increase stool weight via the physical presence of the fibre, the water held by the fibre and increased bacterial mass from fermentation of the fibre(Reference Phillips, Muir and Birkett22). In the present study, the supplemental fibres had no effect on stool weight. In contrast, RS has been reported to increase stool wet weight by 0·7–2·7 g/g RS consumed, using doses from 25 to 55 g/d(Reference Cummings, Beatty and Kingman21–Reference Jenkins, Vuksan and Kendall24). Likewise, 21 g SCF/d was shown to increase faecal dry weight by 0·9 g/g fed(Reference Boler, Serao and Bauer14). However, these studies looked at stool weight over 3–5 d periods. In the present study, stool weight was determined from a single sample, so it is possible that any effect on laxation may have been missed due to the short collection period.
Normal stool frequency ranges from three times per d to three times per week(Reference Chen, Ho and Phua25). The RS treatments led to a minor increase (0·56 stools) in the number of stools on day 6. Most studies have reported no effect of RS on stool frequency in healthy participants when measured over the course of a week or longer(Reference van Munster, Tangerman and Nagengast17, Reference Tomlin and Read18, Reference Maki, Sanders and Reeves23). Timm et al. (Reference Timm, Thomas and Sanders26) reported an increase by 0·9 stools over a 5 d period for participants consuming 20 g SCF/d. However, no laxative effect of SCF was found in the present study. Again, the present study is limited by the fact that stool frequency was only assessed for 1 d. In addition, the present study was conducted in healthy individuals with normal bowel function. Fibre tends to have a normalising effect on bowel frequency, after which only stool weight increases(Reference Slavin20). Thus, it is likely that we would have seen a greater effect in constipated individuals.
SCFA are a marker of fermentation and are considered important for colonic health. We observed a significant increase in total SCFA following the consumption of SCF. Previous studies have also reported higher faecal SCFA concentrations with the consumption of SCF compared with the control, although these differences did not reach significance(Reference Boler, Serao and Bauer14, Reference Stewart, Nikhanj and Timm16). Changes in total SCFA concentrations mirrored differences in pH among the treatments, suggesting that these acids are a major contributor to colonic pH. The increased percentage of butyrate following the consumption of RS in the present study is consistent with other reports both in vitro and in vivo (Reference Phillips, Muir and Birkett22, Reference Jenkins, Vuksan and Kendall24, Reference McOrist, Miller and Bird27). Given the growing evidence for a protective role of butyrate in colonic health, this suggests that addition of RS to food products may be beneficial.
GI tolerance is an important issue when considering fibres for addition to food products, as it may have an effect on the acceptability of the product by the consumer. Mean symptom scores for all the treatments were low (1·6–4·4), indicating that the fibres were well tolerated overall. The SCF treatment appeared to be the best tolerated, and did not differ from the control for any of the measurements. Previous studies have also found SCF to be well tolerated, with only minor increases in GI symptoms compared with the control(Reference Boler, Serao and Bauer14, Reference Stewart, Nikhanj and Timm16). RS was also well tolerated and only differed from the control for flatulence on day 6. This is consistent with other research reporting increased flatulence with RS at doses ranging from 10 to 39 g/d(Reference Stewart, Nikhanj and Timm16, Reference Martinez, Kim and Duffy19, Reference Phillips, Muir and Birkett22).
Although SCF and RS were well tolerated alone, addition of pullulan led to an increase in most GI symptoms. Previous studies have also reported increased symptom ratings following the consumption of 12–50 g pullulan(Reference Stewart, Nikhanj and Timm16, Reference Spears, Karr-Lilienthal and Grieshop28, Reference Wolf, Garleb and Choe29). The present study used only 5 g pullulan, indicating that minor increases in GI symptoms are observed even at low levels. In vitro studies have found that pullulan is rapidly fermented and increases gas production(Reference Maathuis, Hoffman and Evans6, Reference Spears, Karr-Lilienthal and Bauer30). If pullulan is also rapidly fermented in vivo, this may explain the observed increase in symptoms, since gas is perceived more in the proximal bowel(Reference Harder, Serra and Azpiroz31). In contrast, RS and SCF were more slowly fermented in vitro (Reference Maathuis, Hoffman and Evans6), which may lead to improved tolerance.
GI symptoms tended to be lower on day 6 than on day 1. This may be related to distributing the fibre over the course of the day, rather than consuming the fibre in a single dose. This would reduce the amount of substrate available for fermentation and subsequent gas production. Research with sugar alcohols, another form of low digestible carbohydrate, has shown that ingestion of several divided doses is better tolerated than a single dose of the same amount(Reference Livesey5, Reference Tetzloff, Dauchy and Medimagh32). The reduction in GI symptoms from days 1 to 6 may also be related to chronic ingestion of the same fibre source. Okubo et al. (Reference Okubo, Ishihara and Takahashi33) found that flatulence was reported at the beginning of the experiment but gradually declined within the first week of participants consuming partially hydrolysed guar gum. Others have reported habituation and adaptation of GI symptoms when fibre was consumed over a period of several weeks(Reference Pasman, Wils and Saniez34).
The present analyses showed that there was a significant change in the GMC with the dietary interventions. We used two fingerprinting approaches, Alu I-TRFLP, which focuses on the phylum Firmicutes, and Rsa I-TRFLP, which encompasses the phylum Bacteroidetes(Reference Karlsson, Ussery and Nielsen35). However, the changes with dietary enrichment were only associated with Rsa I-TRFLP. In particular, the relative abundance of TRFLP peaks, putatively associated as members of the Parabacteroides genus, increased in abundance when participants consumed SCF and SCF+P. These organisms are non-butyrate-producing bacteria that have previously been associated with a RS enrichment(Reference Martinez, Kim and Duffy19). Hooda et al. (Reference Hooda, Boler and Serao36) also reported a shift in the microbiota following the consumption of 21 g SCF/d for 3 weeks, although differences in the Parabacteroides genus were not observed. This may be due to a shorter length of intervention in the present study.
In contrast to previous research(Reference Martinez, Kim and Duffy19), the RS treatments did not cause an increase in Parabacteroides in the present study. This may be explained by the type of RS used. In the study by Martinez et al. (Reference Martinez, Kim and Duffy19), type 4 RS (chemically modified starch) increased P. distasonis, whereas type 2 RS (granular starch) had no effect; type 3 RS, which was used in the present study, was not evaluated. Walker et al. (Reference Walker, Ince and Duncan37) reported an increase in Ruminococcus bromii and Eubacterium rectale when overweight participants consumed type 3 RS. This was not observed in the present study, and may be due to differences in the microbiota between lean and overweight individuals. These studies have suggested that the effects of fibre on the GMC cannot be generalised, even within a specific class of fibre. While the present study provided an initial screening of the effect of fibre intervention on the GMC, future studies could include a more thorough characterisation of the GMC by sequencing 16S ribosomal RNA genes.
In conclusion, consumption of relatively large doses (20–25 g/d) of RS and SCF was well tolerated and had minimal effects on laxation. Further research using a longer period of bowel habit evaluation in individuals with constipation may help identify potential laxation benefits of these fibres. SCF increased total SCFA production, while RS improved the ratio of butyrate, suggesting that fermentation of these fibres may have beneficial effects in the colon. Additional research is needed to further explore the effects of these fibres on gut microbiota and possible implications for human health.
Acknowledgements
The present study was supported by Tate and Lyle Health and Nutrition Sciences. A. S. K. conducted the study, analysed the samples and wrote the manuscript. M. A. J. H., E. T., F. L. and J. W. L. designed and conducted the microbiota analysis. W. T. coordinated the statistical design and completed the data analysis. J. L. S. obtained funding for the study and supervised the efforts for the study. All authors reviewed and approved the manuscript. The authors have no conflicts of interest to declare.


