


Traditional methods of dietary assessment are subjective and rely on self-report. Therefore, the accuracy of dietary data is influenced by memory recall, burden of administration( Reference Thompson, Subar, Coulston and Boushe 1 ), psychosocial factors( Reference Tooze, Subar and Thompson 2 – Reference Maurer, Taren and Teixeira 4 ), and other behavioural characteristics( Reference Edwards, Lindeman and Mikesky 5 – Reference Hassapidou and Manstrantoni 8 ), with sex( Reference Tomoyasu, Toth and Poehlman 9 – Reference Pikholz, Swinburn and Metcalf 11 ), age( Reference Pikholz, Swinburn and Metcalf 11 – Reference Tomoyasu, Toth and Poehlman 14 ), body size( Reference Pikholz, Swinburn and Metcalf 11 , Reference Tomoyasu, Toth and Poehlman 14 – Reference Heerstrass, Ocke and Bueno-de-Mesquita 18 ) and ethnicity( Reference Tomoyasu, Toth and Poehlman 9 – Reference Pikholz, Swinburn and Metcalf 11 , Reference Gemming, Doherty and Kelly 19 ) all being shown to affect reporting.
To address these constraints, considerable interest has been shown in the use of image-assisted dietary assessment( Reference Bai, Li and Yue 20 – Reference Six, Schap and Kerr 24 ). Handheld devices were first used to capture the images of foods manually, but the development of automated wearable cameras has allowed the capture of first-person point-of-view images to be explored( Reference Gemming, Doherty and Kelly 19 , Reference Arab and Winter 25 – Reference O'Loughlin, Cullen and McGoldrick 27 ). Wearable cameras provide a new opportunity to improve the accuracy of dietary assessment as the images/videos provide a passive and objective record of an individual's eating episodes( Reference Sun, Fernstrom and Jia 21 ).
Initial estimates suggest that wearable camera-assisted methods may have a relatively small measurement error for energy intake (EI) (7 %)( Reference Arab, Estrin and Kim 26 ), and that they increase self-reported EI by 10–18 % compared with traditional methods( Reference Gemming, Doherty and Kelly 19 , Reference O'Loughlin, Cullen and McGoldrick 27 ). The increased EI results from the detection of unreported foods, changes in reported portion size, and other misreporting errors identified within the images( Reference Gemming, Doherty and Kelly 19 ). However, previous studies have relied on participants to manually capture images( Reference Arab, Estrin and Kim 26 ), had small sample sizes( Reference Gemming, Doherty and Kelly 19 , Reference Arab, Estrin and Kim 26 ), and none has validated wearable camera-assisted dietary assessment against a criterion measure, such as doubly labelled water (DLW)( Reference Gemming, Doherty and Kelly 19 , Reference O'Loughlin, Cullen and McGoldrick 27 ).
Therefore, the primary aim of the present study was to use the DLW technique to validate a wearable camera-assisted 24 h dietary recall. The analyses compared reported EI measured from 24 h dietary recalls alone and dietary recalls plus the wearable camera (SenseCam (SC)), and with total energy expenditure (TEE) estimated using the DLW method. A secondary objective was to examine the mechanism by which camera images enhance dietary recalls by quantifying alterations in self-report after viewing the images.
Subjects and methods
A total of forty volunteers, aged 18–64 years (twenty males and twenty females), from the greater Auckland city metropolitan area, New Zealand were recruited by advertisements on community notice boards located at fifteen supermarkets and three university campuses, and by a campaign through a participant recruitment service website (http://www.researchstudies.co.nz). The recruitment service sent email announcements to individuals who had previously indicated interest in human research, and used paid advertisement campaigns on Facebook. Potential participants who indicated interest were phoned, assessed for eligibility, and provided with written and verbal information regarding study procedures. Written informed consent was obtained from all the participants before the commencement of the study.
Participants were informed that the purpose of the research was to evaluate the use of Passive Image Capture to Record Everyday Events using wearable cameras. There was no specific reference to a validation study, but participants were informed that the images would be used to help assess their dietary intake and other health behaviours, such as the time spent watching television or travelling to work (not reported here).
All eligible participants were in self-reported good health, were not actively pursuing weight loss, and did not plan to conduct additional physical activity (above normal) or travel during the study period. Pregnant and lactating females, or individuals with a recent acute illness, who had their blood tests taken or took intravenous fluids 2 weeks before the study period were excluded. Recruitment efforts were targeted at all adults aged 18–65 years; however, it was ensured that an equal number of male and female participants were selected for the study. The University of Auckland Human Participants Ethics Committee approved the research (reference no. 8701). An $80 New Zealand Dollar gift card was given to the participants at the completion of the study to compensate them for their time.
Study design
The present study was a cross-sectional, repeated-measures design. Each participant took part in the study over 15 d in free-living conditions and wore a wearable camera for 4 d, and data were collected at four appointments (a baseline assessment and three follow-up dietary assessments). Data collection was conducted between March and September 2013.
Participants were contacted 1–3 d before their scheduled baseline assessment to reaffirm the study procedures and to schedule the nutrition assessments. Participants fasted overnight ( ≥ 10 h) and were instructed to refrain from any strenuous activity the day before the baseline assessment. Anthropometric characteristics including weight in light clothing with shoes and jewellery removed ( ± 0·05 kg, Tanita BWB-620), height ( ± 0·1 cm, Seca 213), and percentage of body fat ( ± 5 ohm, Imp DF50; ImpediMed) were assessed.
Resting energy expenditure (REE) was measured before the participants were given a weight-specific dose of DLW to determine TEE during the study period. Participants then wore a wearable camera (SC) for 4 d: one familiarisation day; each day before three interviewer-administered multiple-pass 24 h dietary recalls (MP24) conducted on days 2–4 (nutrition assessment 1), days 8–10 (nutrition assessment 2) and days 13–15 (nutrition assessment 3). Therefore, there was a minimum of 3 d and a potential maximum of 8 d between the nutrition assessments.
For the determination of TEE, five timed urine samples were collected at baseline, 5 h post-dose, and on days 3, 9 and 15. Participants were instructed to collect at least 50 ml of the second void of the day, to place and seal the sample in a specimen pot, and to record the time of void on a form provided. The samples were collected from the participants at the earliest opportunity, either at the next nutrition assessment or from their home (if diet was assessed before the collection). To assess any weight change during the testing period, body mass was reassessed on day 15 using the same scales. During the study period, participants were told to follow their usual daily routine. A basic instruction leaflet for SC and a timeline of scheduled study assessments were provided at the end of the baseline assessment. Standardised text messages were used to remind the participants of the study protocol (e.g. day 3: please remember to collect urine sample #3 (not the first void of the day) Passive Image Capture to Record Everyday Events study). Messages were sent at times to align with the participant's reported usual daily schedule.
Use of the wearable camera
SC is a wearable camera worn around the neck on a lanyard with a wide-angled lens( Reference Hodges, Williams, Berry, Dourish and Friday 28 , Reference Doherty, Hodges and King 29 ). Sensors detect movement (accelerometer), heat (IR) and light to trigger image capture approximately every 20 s (approximately 2000–3000 images/d). Internal flash memory is sufficient for 1 week and battery capacity is adequate for a typical 12–16 h/d. Once turned on, SC operates continuously until the camera is switched off, or a privacy button can be activated to cease image capture temporally (7 min). Participants were provided instructions to operate and wear the device correctly at the baseline assessment. On the recording days, participants were instructed to wear the device from wake time (after bathing and dressing) until bedtime, but they could remove the camera anytime they felt uncomfortable or in locations where photography was inappropriate (e.g. gymnasium or public restroom). An information sheet was provided to help the participants determine when the camera should be switched off or not be worn. The images were encrypted to ensure that participants could not view the images before the nutrition assessment, or if lost, they could not be viewed by third parties. After the completion of each MP24, participants were provided with a chance to screen the images privately and instructed to delete any image they did not wish to disclose before a joint image review with the researcher( Reference Kelly, Marshall and Badland 30 ).
Energy intake assessment
Multiple-pass 24 h dietary recalls
Dietary recalls were conducted by a trained dietitian (L. G.) using a pen-and-paper-based multiple-pass method with a forgotten foods list to probe for unreported foods, adopted from the US Department of Agriculture( Reference Moshfegh, Rhodes and Baer 31 ) followed by an image review (see Fig. 1). The assessments were conducted at the University of Auckland or at participants' homes/workplaces. Standard household measures, example crockery and glassware, and a portion size guide were used to assist the participants to estimate portion sizes. The portion size guide used( Reference Probst 32 ) was developed for the Australian population where the food supply is similar to that in New Zealand (no New Zealand-specific portion size guide was developed).
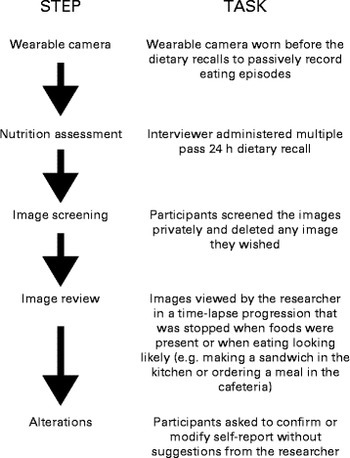
Fig. 1 Procedure to estimate energy intake in wearable camera-assisted dietary recalls.
Multiple-pass 24 h dietary recalls+SenseCam
After the final pass of MP24, the researcher (L. G.) used Doherty's wearable camera browser( Reference Doherty, Pauly-Takacs and Caprani 33 ) to review the SC images with the participants (after the images were screened privately by the participants). The participants were instructed to confirm, modify, add or remove food items present in the images (MP24+SC). To assist the process, the researcher simply restated the foods and portions that were self-reported in the MP24, and queried any unreported food items present in the images, but did not suggest any changes or scrutinise self-reported intakes. All changes made by the participants were detailed to determine the frequency and impact on EI. All unreported foods, misreporting errors and alterations to portion size were grouped by the following food categories: breads and cereals; beverages (excluding water due to no energy content); fruit and vegetables; meats and fish; dairy products; snack foods (biscuits, sweets and other snack foods); condiments (spreads, sauces, dips and dressings); alcohol; and other. The changes in self-report were both individual foods and composite foods (some foods cannot be separated into individual components).
Measurement of total energy expenditure
Daily TEE was measured using the DLW method. At the baseline assessment, participants ingested a pre-mixed dose of approximately 0·1 g of 99·9 % 2H2O/kg total body water and 2 g of 10 % H2 18O/kg total body water. To ensure that the full dose was consumed, the dose bottle was rinsed three times with tap water followed by an additional mouth rinse. To ascertain background isotope levels, a baseline urine sample was collected before dosing. Participants collected timed urine samples (5 h post-dose and on days 3, 9 and 15) that were frozen (in duplicate in glass bottles) until study completion and analysed using an elemental analyser (Thermo Scientific TC/EA) coupled with a isotope ratio mass spectrometer (Thermo Scientific DeltaV advantage). Daily TEE was calculated by the multi-point method using linear regression from the difference between the elimination constants of 18O and 2H, with individual respiratory quotient determined using the mean of the three MP24+SC measures( Reference Prentice 34 ).
Resting energy expenditure
A standardised protocol was used to assess REE between 07.00 and 10.00 hours. TEE was divided by REE to calculate the participants' activity factor during the study period. Participants were instructed to fast overnight ( ≥ 10 h) and refrain from any strenuous activity the day before the assessment. Before commencement, participants were positioned (near supine) on a folding bed for ≥ 10 min, and asked to relax but remain awake. Testing was conducted in an environmental chamber maintained at 22°C with lights turned off during all assessments (participants remained awake throughout). REE was measured by indirect calorimetry using a mouthpiece and nose clip, and analysed breath by breath with a Moxus Modular system (S-3A/I Oxygen Analyser, CD-3A Carbon Dioxide Analyser and KTC3 Turbine Volumetric System; AEI Technologies). A 30 min measurement protocol was followed, with the data from the first 10 min and final 2 min being omitted, along with the periods of movement by the participants. Before each assessment, the metabolic cart was calibrated with standard gas mixtures and a volumetric syringe.
Statistical analysis
Data of all participants were included in the final analysis, as device non-compliance and technical issues best reflect free-living conditions. Dietary intake was analysed using the nutrient analysis software FoodWorks 7 Professional edition (Xyris Software). Data analysis was performed using the software package for statistical analysis SPSS Statistics (version 20.0; IBM). Paired t tests were used to compare differences in self-reported EI between the MP24 and MP24+SC methods used, and between EI and TEE. Limits of agreement between self-reported EI measured from the MP24 and MP24+SC methods, and TEE were assessed according to the recommendations of Bland & Altman( Reference Bland and Altman 35 ). Alterations in self-report (MP24+SC) and participant characteristics were described by summary statistics. Statistical significance was set at α ≤ 0·05.
Results
All the participants completed the study procedures. The general characteristics of the study population are presented in Table 1. Participants were predominantly New Zealand Europeans and the majority had tertiary education; however, differences in age, body size and education between the male and female participants were apparent. Men were predominately overweight or obese (65 %) and approximately 8 years older than women who were generally of normal body weight (75 %). Moreover, a greater proportion of women had attended university or completed graduate degrees (80 v. 65 %). The mean body weight did not differ significantly between day 0 and day 15 for men or women (mean difference − 0·1 (sd 0·9) kg, P= 0·546 and − 0·1 (sd 1·0) kg, P= 0·716, respectively).
Table 1 Demographic characteristics of the study participants (Mean values and standard deviations)
TEE measures and EI data for all the forty participants were used. Only three participants did not wear the camera for one of the three recording days (two participants reported that they were in bed for most of the day, and one participant was non-compliant for one of the three recording days), and six devices malfunctioned, which resulted in failure to capture the images. Additionally, on two occasions, participants forgot to bring the camera to the assessment venue. However, the MP24 was still conducted as usual and thus the MP24 and MP24+SC simply had the same values for these eleven instances (9 % of the total dietary recalls). Regarding the image screening, the proportion of the participants that chose not to screen the images privately increased at each successive nutrition assessment (n 13, n 18 and n 25, respectively). The median time of image screening was 5·5 min (range 1·0–17·1 min, interquartile range 5·2 min).
For both males and females, the 24 h dietary recalls were distributed across all the days of the week, but the proportion was lower on weekend days, as shown in Table 2. The mean TEE measured by the DLW method and reported EI assessed from the three 24 h dietary recalls (MP24 and MP24+SC) are presented in Table 3. For men, the mean reported EI were 17 % (MP24) and 9 % (MP24+SC) below the measured TEE. For women, the mean reported EI were 13 % (MP24) and 7 % (MP24+SC) below the TEE. The raw correlations between TEE and EI assessed by the MP24 and MP24+SC methods were, respectively, 0·68 and 0·61 for men. The correlations were, respectively, 0·82 and 0·81 for women. An assessment of agreement revealed that EI does not influence the magnitude of measurement error (see online supplementary material). The reduced magnitude of under-reporting of EI is presented in Fig. 2. The assistance of the wearable camera (MP24+SC) significantly reduced under-reporting for both men and women compared with the MP24 alone in all the three dietary recalls, and there was no significant difference observed between TEE and EI measured by the MP24+SC method in nutrition assessment 2.
Table 2 Distribution of the dietary recalls collected for the total sample of participants* by day of the week
* Each participant (n 40) had three multiple-pass dietary recalls obtained over a 2-week period.
Table 3 Daily energy intake (EI) measured in three multiple-pass 24 h dietary recalls (MP24 and MP24+SenseCam (SC)) and total energy expenditure (TEE) measured with the doubly labelled water technique (Mean values and standard deviations)
* Mean value was significantly different from that of the MP24 (P≤ 0·05).
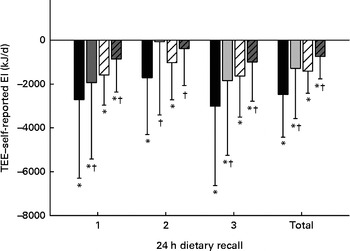
Fig. 2 Under-reported energy intake in the multiple-pass 24 h dietary recall alone (MP24) and with the assistance of the wearable camera (MP24+SenseCam (SC)) compared with total energy expenditure (TEE) for men and women. * Mean value was significantly different from that of TEE (P≤ 0·05). † Mean value was significantly different from that of the MP24 (P≤ 0·05). MP24: ![]() (male),
(male), ![]() (female); MP24+SC:
(female); MP24+SC: ![]() (male),
(male), ![]() (female).
(female).
Increased EI associated with the MP24+SC measure is presented in Fig. 3. There was no relationship evident between the increase in EI and TEE, but viewing the images sometimes resulted in a decreased EI. Alterations in the participants' self-reported EI are summarised in Table 4. The increase in reported EI was predominantly due to the addition of 265 unreported foods. Portion size was increased in most instances (n 49/51), but, overall, this had a less impact on reported EI than unreported foods that were removed or exchanged during the image review.

Fig. 3 Changes in self-reported energy intake in the multiple-pass 24 h dietary recalls (MP24) after viewing the wearable camera images (MP24+SenseCam (SC)) compared with total energy expenditure (TEE) for men (![]() ) and women (
) and women (![]() ) (n 120, three 24 h dietary recalls for each participant).
) (n 120, three 24 h dietary recalls for each participant).
Table 4 Alterations in self-reported energy intake for all the participants viewing wearable camera images after completion of the multiple-pass 24 h dietary recalls (Number of participants, mean values and standard deviations)
REE data of one male and three females were excluded as the participants did not achieve a rested state during the REE procedures. REE and activity factor were, respectively, 7807 (sd 2125) kJ and 1·9 (sd 0·5) for men and 6548 (sd 2033) kJ and 1·8 (sd 0·6) for women.
Discussion
The present study validated a wearable camera-assisted dietary recall against the DLW technique, and examined the impact of wearable cameras on dietary under-reporting. Overall, the assistance of the wearable cameras significantly reduced the magnitude of under-reporting of dietary EI by 8 % for men and 6 % for women compared with the dietary recall alone. The findings confirm the preliminary research suggesting that wearable cameras may reduce measurement error by revealing unreported foods and misreporting errors( Reference Gemming, Doherty and Kelly 19 , Reference O'Loughlin, Cullen and McGoldrick 27 ).
The degree of under-reporting of dietary EI observed in the MP24 alone (male 17 % and female 13 %) was similar to that reported in other studies on the DLW validation of 24 h dietary recalls, which have reported EI values approximately 8–24 % below the TEE( Reference Livingstone and Black 36 ). To date, when compared with the DLW study with the largest size of samples (n 524), which validated the automated multiple-pass 24 h dietary recall method, the level of under-reporting bias for dietary EI was comparable for males (14 % among overweight men and 20 % among obese men compared with 17 % among men in the present study) but higher for females (6 % among women with a normal body weight compared with 13 % among women in the National Health and Nutrition Examination Survey)( Reference Moshfegh, Rhodes and Baer 31 ). The lower value observed in the validation of the automated multiple-pass method was likely attributable to the use of the structured automated multiple-pass method software (not the pen-and-paper-based), and robust trial conditions used to replicate the procedures of the National Health and Nutrition Examination Survey( Reference Moshfegh, Rhodes and Baer 31 ) in conjunction with a motivated sample, which received substantial financial incentives.
There have been only a few studies on the DLW validation of image-assisted dietary assessment methods. A custom-built wearable camera ‘eButton’ designed to objectively assess dietary intake and physical activity has been demonstrated, but is yet to be validated( Reference Bai, Li and Yue 20 , Reference Sun, Fernstrom and Jia 21 ). Other image-assisted dietary assessment methods in development differ as they require the participants to capture the images actively using smart phones or other handheld devices. Nonetheless, validation of the remote photography food method (a manually triggered image-based dietary record) against the DLW technique among free-living adults (predominantly overweight and obese) revealed reduced measurement error compared with traditional methods (mean EI 6 % below the TEE v. 12–49 % among overweight and obese populations reported elsewhere)( Reference Bandini, Schoeller and Cyr 15 – Reference Lichtman, Pisarska and Berman 17 , Reference Martin, Correa and Han 22 , Reference Moshfegh, Rhodes and Baer 31 , Reference Buhl, Gallagher and Hoy 37 – Reference Black, Jebb and Bingham 39 ). Similar image-based dietary records in development are yet to be validated with human participants in free-living settings( Reference Weiss, Stumbo and Divakaran 23 , Reference Six, Schap and Kerr 24 ).
Several factors may explain why dietary under-reporting was not completely eliminated with the assistance of the wearable camera. The imaging frequency of wearable cameras was insufficient (two to three images per min) to capture all the foods consumed, and image quality was relatively poor, especially in low-light environments. Moreover, the position of the camera on the body allows the lens angle to be affected by posture, and foods in bowls or on high tables can be obscured easily. Intentional under-reporting may also go undetected if participants delete the images of foods during the private screening. However, the short duration that participants took to screen the images and the proportion of the participants who chose not to screen their images in the second and third nutrition assessments suggested this was not a frequent issue. Reactivity could also be a factor. Previous studies have indicated that the use of wearable cameras is a low burden, but may have an impact on the participants' usual dietary behaviours; however, the degree of behaviour change was unclear( Reference Gemming, Doherty and Kelly 19 , Reference Arab, Estrin and Kim 26 ). Additional dietary recalls for non-camera days would have provided a within-person comparison to assess reactivity.
Other study limitations include the relatively small heterogeneous sample that was not representative of the general population; therefore, the study may have produced different results. Moreover, due to differences in body size, male and female data were treated separately. However, participants of all body sizes were deliberately recruited as the earlier feasibility study has revealed that camera-assisted recalls were helpful for all body types of people( Reference Gemming, Doherty and Kelly 19 ). Additionally, the prevalence of under-reporting increased substantially in New Zealand's most recent adult nutrition survey among people with a normal body weight, as well as among overweight and obese individuals( Reference Gemming, Jiang and Swinburn 40 ). Furthermore, a sole dietitian conducted nutrition assessments and the image review process; thus, interviewer bias cannot be ruled out (interview procedures were not audited). Additionally, dietary intake data may not be representative of usual intake, due to the short duration of the study, the limited number of dietary recalls conducted, and the lower proportion of weekend days v. weekdays( Reference Basiotis, Welsh and Cronin 41 ).
A unique feature of the study was the detailed comparison between traditional self-report alone v. self-report assisted by the wearable camera. The design of the present study allowed the determinants of under-reporting to be identified, and confirmed that unreported snack foods, condiments and beverages are the primary source of under-reported EI in a free-living setting. Similar to the feasibility study( Reference Gemming, Doherty and Kelly 19 ), a range of foods were revealed by the images, and included both healthy and unhealthy foods. These were generally individual food items, such as biscuits, peanut butter and soda, but included some composite foods, such as cheese burgers, vegetable soup and butter chicken. Interestingly, fruit and vegetables were unreported frequently (n 47/265 foods). Often these were snacks, such as bananas, apples, carrots and raisins, which further highlighted the difficulty for participants to remember the details of their snacking episodes during retrospective assessments. The alterations by participants to portion size may have produced correlated errors (as the true portion size remained unknown)( Reference Hernández, Wilder and Kuehn 42 – Reference Ovaskainen, Paturi and Reinivuo 44 ), but in most instances, the portion size was clearly incorrect (e.g. two v. one slice of toast). The decision not to question or scrutinise the participants' self-report during the image review reduced the potential for interviewer bias( Reference Gibson 45 ), but trained image analysts or use of automated image-analysis techniques could enhance the method further( Reference Martin, Correa and Han 22 , Reference Zhu, Bosch and Boushey 46 ).
The strength of automated wearable cameras over handheld devices is their ability to capture images passively, which means they are potentially less intrusive during daily activities and may reduce participant burden. Wearable technologies can also collect physical activity data passively (using inbuilt accelerometers and global positioning system (GPS)), a key lifestyle consideration often overlooked when collecting dietary intake data( Reference Black 47 , Reference Black 48 ). Thus, wearable technologies have a greater potential than simply revealing unreported foods and misreporting errors, which needs to be explored.
Conclusions
The wearable camera significantly reduced the magnitude of under-reporting in the 24 h dietary recall by 9 % for men and 6 % for women, as the images revealed unreported foods and misreporting errors not captured by the traditional method alone. Wearable cameras with faster imaging frequencies, high-definition image sensors, and the use of automated image analysis techniques may enhance the method further. Additional research is needed in larger representative samples of the population. Future studies should explore the use of wearable cameras in different settings using a variety of image-assisted methods.
Supplementary material
To view supplementary material for this article, please visit http://dx.doi.org/10.1017/S0007114514003602
Acknowledgements
The present study was not supported by any external funding source.
The authors' responsibilities are as follows: L. G., C. N. M., E. R., R. M., A. D. and N. G. contributed to the study design; L. G. and C. N. M. were involved in the data collection and study management; L. G., E. R., R. M. and N. G. carried out the energy expenditure analyses; L. G., C. N. M., E. R., R. M., A. D., N. G. and J. U. interpreted the data; L. G. performed the statistical data analysis; L. G. wrote the manuscript; C. N. M., E. R., R. M., A. D., N. G. and J. U. edited the manuscript.
None of the authors had a personal or financial conflict of interest.


