


CVD was the leading cause of death in the United States in 2011( Reference Hoyert and Xu 1 ). Several metabolic risk factors are known to increase the risk of CVD both independently and synergistically( Reference Voight, Peloso and Orho-Melander 2 , Reference Go, Mozaffarian and Roger 3 ). These include hypertension( Reference Thomas, Rudnichi and Bacri 4 , Reference Vasan, Larson and Leip 5 ), hypertriglyceridemia( Reference Sarwar, Danesh and Eiriksdottir 6 , Reference Cullen 7 ), insulin resistance (marked by hyperglycemia and hyperinsulinemia)( Reference DeFronzo and Ferrannini 8 , Reference Hanley, Williams and Stern 9 ), lowered HDL-cholesterol (HDL-C)( Reference Cooney, Dudina and De Bacquer 10 , Reference Asztalos, Collins and Cupples 11 ), increased LDL-cholesterol (LDL-C)( Reference Lu, Resnick and Jablonski 12 , Reference Howard, Robbins and Sievers 13 ), increased C-reactive protein (CRP) levels( Reference De Ferranti and Rifai 14 ) and obesity (particularly abdominal obesity manifesting as a larger waist circumference; WC)( Reference Wildman, Gu and Reynolds 15 – Reference Zhu, Heshka and Wang 17 ).
The etiology of CVD and its risk factors is multifactorial and comprises genetic, behavioural, psychosocial and nutritional components( Reference Go, Mozaffarian and Roger 3 ). In recognition of the importance of overall diet in the prevention of chronic diseases, including CVD, dietary guidelines in several countries have been developed for the prevention of chronic diseases (e.g. American Diabetes Association( 18 ), Lichtenstein et al. ( Reference Lichtenstein, Appel and Brands 19 ), Guenther et al. ( Reference Guenther, Casavale and Reedy 20 ), Peterkin( Reference Peterkin 21 ), McGuire et al. ( Reference McGuire 22 ), Becker et al. ( Reference Becker, Lyhne and Pedersen 23 ), National Health and Medical Research Council( 24 )). These guidelines make recommendations regarding both the quality and variety of overall diet, rather than focusing solely on individual nutrients( Reference Marshall, Burrows and Collins 25 , Reference Wirt and Collins 26 ). Although individual guidelines vary somewhat, the overall recommendations for health almost universally focus on a pattern of intake which emphasises vegetables and fruits, whole grains, low-fat dairy, nuts, seeds, fish and unsaturated fatty acids( Reference Go, Mozaffarian and Roger 3 , Reference Lichtenstein, Appel and Brands 19 , Reference McGuire 22 ). The Dietary Guidelines for Americans are released every 5 years by the US Department of Agriculture (USDA) in conjunction with the US Department of Health and Human Services( Reference McGuire 22 ). These guidelines encompass recommendations across twelve food group categories, including total fruits, whole fruits, total vegetables, greens and beans, whole grains, dairy, total protein foods, seafood and plant proteins, fatty acids, refined grains, Na and empty energy. To assess adherence to the current Dietary Guidelines for Americans, the USDA developed the Healthy Eating Index (HEI)( Reference Guenther, Casavale and Reedy 20 ). The HEI is a diet quality index that was most recently updated for the current Dietary Guidelines for Americans, which were released in 2010 (HEI-10). A high HEI score (indicating greater adherence to the Dietary Guidelines for Americans) has been associated with a small decrease in CVD incidence and mortality( Reference McCullough, Feskanich and Stampfer 27 – Reference Reedy, Krebs-Smith and Miller 30 ) as well as a reduction in CVD risk as a result of lower blood pressure, increased HDL-C, decreased LDL-C, lower CRP levels and decreased fasting insulin( Reference Nicklas, O'Neil and Fulgoni 31 , Reference Ford, Mokdad and Liu 32 ).
Despite the widespread adoption of diet quality indices to help prevent chronic disease, several deficiencies remain in our understanding of the association between diet quality and CVD risk factors. First, surveying large numbers of the population has necessitated the use of self-report dietary intake data. Self-report nutrition data are subject to underreporting for intake( Reference Schoeller, Thomas and Archer 33 – Reference Heitmann and Lissner 35 ), and the degree of underreporting can be sex specific( Reference Mertz, Tsui and Judd 34 ). Nutrient density models have been developed to correct dietary quality scores for underreporting by adjusting for overall reported intake( Reference Willett, Stampfer and Willet 36 ). These models employ energy-adjusted dietary quality, which does not show the same degree of underreporting that absolute dietary quality does( Reference Voss, Kroke and Klipstein-Grobusch 37 ). However, nutrient density models have not been employed by previous research efforts on the association between the HEI and CVD risk factors, which has created the potential for biased parameter estimates and variability between studies due to methodological differences( Reference Willett, Stampfer and Willet 36 , Reference Freedman, Guenther and Krebs-Smith 38 ). Second, some studies have employed intra-individual associations between diet quality and CVD risk factors when using 24-h recall data( Reference Nicklas, O'Neil and Fulgoni 31 ), which are best used at the group level, to aggregate out unrepresentative responses( Reference Willett 39 ). For this reason, nutrient density substitution models have been adapted for use in group comparisons in the population ratio approach( Reference Freedman, Guenther and Krebs-Smith 38 ). Finally, studies have not explicitly examined the extent to which BMI attenuates the relationship between diet quality and CVD risk. Although not all overweight or obese people have elevated CVD risk factors( Reference Calori, Lattuada and Piemonti 40 ), at the population level, obesity is a strong risk factor for CVD and BMI is strongly associated with all metabolic CVD risk factors( Reference Go, Mozaffarian and Roger 3 , Reference Malik, Wong and Franklin 41 – Reference Krauss, Winston and Fletcher 43 ) as well as, to a moderate extent, with HEI-assessed diet quality( Reference Nicklas, O'Neil and Fulgoni 31 , Reference Gao, Beresford and Frank 44 – Reference Ervin 46 ). CVD risk, BMI and diet quality are all interrelated, but the reported associations between CVD risk and HEI scores have been small to moderate( Reference McCullough, Feskanich and Stampfer 27 – Reference McCullough, Feskanich and Rimm 29 ), whereas the associations between obesity and both CVD and HEI have been stronger. We therefore hypothesised that the association between diet quality, as measured by the HEI, and CVD risk factors is partly mediated by BMI.
The goal of the present analyses was to use data from a large, nationally representative sample of the US population (National Health and Nutrition Examination Survey; NHANES), which was collected in three waves between 2005 and 2010, to examine whether any associations between total HEI-10 score and the CVD risk factors of hypertension, hyperlipidemia, glycemia measures, HDL-C, LDL-C and CRP were attenuated when controlling for the association between BMI or central adiposity (WC) and these CVD risk factors. In addition, we aimed to use a statistical approach which corrects for the underreporting of dietary intake at the group level, stratified by sex, to examine previously reported associations between CVD risk factors and dietary quality.
Experimental methods
Population
NHANES is an ongoing national survey conducted by the National Center for Health Statistics of the Centers for Disease Control and Prevention (CDC). NHANES is designed to assess the health and nutritional status of the US population by collecting a representative cross-sectional sample of the US non-institutionalised civilian population. The sampling methods have been described in detail elsewhere( 47 ); in brief, NHANES employed a complex multi-stage sampling approach based on the selection of counties, blocks, households and the number of people within a household. To correct for non-responses and unequal probabilities for selection among the US ethnicities, the CDC has provided sampling weights for use in analysis.
We included data from three cycles of NHANES: 2005–6, 2007–8 and 2009–10 (n 31 034). We included non-pregnant participants aged 20 years or older who (1) had completed the interview and the examination, (2) had provided 24-h in-person dietary data for at least the first day, (3) had data on BMI, (4) had examination data on at least one CVD risk factor (total n 13 828) and (5) had not specified their race as ‘other’ (due to small group size). This left us with a final sample of 13 217. We subsequently excluded individuals who were missing data on any of the covariates (age, ethnicity, education level, poverty:income ratio (PIR), smoking, alcohol use or physical activity for men and women, plus menopausal status for women), including the sampling weight (as was required by our analytic strategy), which left a total study population of 9797 (5250 men and 4547 women).
Those without information on fasting status, those without a value for the sample weight for fasting data, and those who did not report fasting for at least 8·5 h before attending the examination were excluded from analyses of outcomes of fasted CVD risk factors (5452 participants excluded; 4345 remaining). Participants excluded from the analysis of fasted outcomes were not different in terms of age, sex, ethnicity or education level than those who were included in the analysis of non-fasted outcomes (P>0·05; online supplementary Table S1).
Measures
Dietary intake
24-h In-person dietary recall interviews were conducted at a mobile examination centre using a multi-pass technique over two separate days. All details of the dietary recall interview, including the multi-pass technique, are available in the NHANES dietary interviewers' procedures manual( 48 ). Methods for including more than one 24-h recall within the population ratio method have not been validated for the 2010 HEI; therefore, only data from the first day 24-h recall were used in the present analyses( Reference Freedman, Guenther and Krebs-Smith 38 ).
Daily total energy intake (kcal)
Daily total energy intake (kcal) was provided by the CDC within the NHANES data. Total intake was calculated by converting reported food intake into macronutrient intake values for each food using the reported serving size and the USDA's Food and Nutrient Database for Dietary Studies( 49 ). The macronutrients were converted to energy using the following conversion factors: 16·7 kJ/g (4 kcal/g) for protein and carbohydrate and 37·7 kJ/g (9 kcal/g) for total fat and saturated fat.
Dietary quality
Total HEI-10 score was used as a measure of dietary quality. Information on the HEI-2010 and its scoring method has been described elsewhere( Reference Guenther, Casavale and Reedy 20 ), but in brief, total HEI-10 score is created from twelve dietary components, each of which reflected a discrete aspect of the Dietary Guidelines for Americans 2010( Reference McGuire 22 ): total fruits, whole fruits, total vegetables, greens and beans, whole grains, dairy, total protein foods, seafood and plant proteins, fatty acids, refined grains, Na and empty energy. Each component has a minimum score of 0 and a maximum score between 5 and 20. Each component is scored such that a higher value indicates better adherence to dietary guidelines. Details of the contribution of each food component to the total HEI-10 score is given in online supplementary Table S2. To partially control for the underreporting of diet intake, raw HEI scores were adjusted using the population ratio approach( Reference Freedman, Guenther and Krebs-Smith 38 ). In brief, the population ratio is calculated using three steps: first, individual levels of food and nutrient intakes are calculated. Second, weighted means and a variance–covariance matrix of the four quartile residual groups used in the present analyses are generated. Using the means and the variance–covariance matrix, a Monte Carlo simulation dataset is generated to calculate standard errors of the HEI score in the group. Third, densities (per 4184 kJ (1000 kcal)) and percent (of total energy intake) are created using the simulation data. The population ratio approach calculates each component of the HEI-10 as a ratio of the population's energy total. The population ratio approach has been shown in computer simulations to give rise to the least biased content estimates from three approaches (the mean score, the mean ratio score and the population ratio), and it has been validated for use with the US population( Reference Freedman, Guenther and Krebs-Smith 38 ). To create the total HEI-10 score, each component ratio score was summed. The total HEI score ranges from 0 to 100, with higher scores indicating higher diet quality.
CVD risk factors
Systolic blood pressure (SBP) and diastolic blood pressure (DBP) were measured in a sitting position after 5 min of quiet rest. Certified physician examiners for blood pressure measured three consecutive readings of blood pressure. A fourth reading was recorded if any of the three measurements was interrupted or incomplete. For both SBP and DBP, we excluded participants who had a DBP reading of less than 30 mmHg and used the average of all available readings. CRP concentrations were measured by high-sensitivity latex-enhanced nephelometry.
Fasting blood samples were collected during examination in the mobile examination centre for measures of glucose metabolism and lipid. Fasting glucose was measured using the hexokinase enzmatic assay; TAG were enzymatically measured with a series of coupled reactions; HDL-C was determined by using the direct HDL-C immunoassay method. NHANES does not provide information on equipment details or accuracy information for measures. All NHANES quality assurance and quality control protocols (QA/QC) meet the 1988 Clinical Laboratory Improvement Act mandates and are described in the NHANES Laboratory/Medical Technologies Procedures Manual (available at http://www.cdc.gov/nchs/data/nhanes/nhanes_09_10/lab.pdf).
Body weight, height and WC were measured and recorded by trained health technicians in the mobile examination centre. Participants were weighed in kg using a digital weight scale. Height was measured in a standing position using a stadiometer with a fixed vertical backboard. BMI was calculated as weight in kg divided by height in m2. The WC was measured at a point immediately above the iliac crest on the midaxillary line to the nearest 0·1 cm at the end of normal expiration.
Demographic and health behaviour information
Demographic information was obtained via interviews in the home. Race/ethnicity was recorded as Mexican American, Other Hispanic, Non-Hispanic White or Non-Hispanic Black. Education level was recorded in three categories: lower than high school diploma, high school graduation, and higher than high school graduation. We categorised the family PIR into three categories ( ≥ 0·0 to 1·3, >1·3 to 3·5 and >3·5) according to Supplemental Nutrition Assistance Program eligibility. Smoking was categorised into three groups (never, former and current smokers) on the basis of two self-report questions on smoking status. Alcohol use was a categorised as yes/no, with ‘yes’ indicating at least twelve drinks in any 1 year. Physical activity was measured as the total metabolic equivalent of task-h/week, which were estimated from self-reported leisure-time activity level. For the 2005–6 data, we used the individual metabolic equivalent of task score for each leisure activity for calculation and summed values for all types of activities. Because the individual metabolic equivalent of task score was not available for the 2007–10 data, we calculated the individual metabolic equivalent of task scores using 4·0 and 8·0 for moderate and vigorous leisure-time physical activities, respectively( Reference Ainsworth, Haskell and Whitt 50 ). Menopausal status (yes/no) was defined using three questions about the presence or absence of periods in past 1 year, the reason for amenorrhea and whether both ovaries were removed.
Analyses
All analyses were conducted in SAS version 9.3 (SAS Institute, Inc.). As described earlier, the population ratio approach was used to reduce bias in the estimate of the HEI-10 score( Reference Freedman, Guenther and Krebs-Smith 38 ). The population ratio approach necessitates the use of means comparisons between groups, and it is only suitable for use in univariate analyses (t test comparisons). However, there are well-established risk factors that are associated with both low-dietary quality and raised BMI, which could confound potential associations between BMI and dietary quality. Therefore, we took the following analytic steps, which are commonly used to control for covariates in univariate analyses (e.g. Li et al. ( Reference Li and van der Sijde 51 )), to determine whether the total HEI-10 score differed for CVD risk factors and whether any associations remained after controlling for BMI in sex-stratified analyses.
-
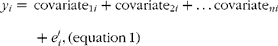
(1) First, each risk factor was individually regressed for the covariates (ethnicity, education level, PIR, smoking, alcohol use, physical activity and menopausal status within women) using the model in equation 1:
where y i refers to a CVD risk factor for the ith individual; covariate1i refers to a covariate for the ith individual; covariate2i refers to another covariate for the ith individual; covariate ni indicates all covariates that were used in a similar manner for the ith individual; and e′ i refers to the residuals of the CVD factor, which is independent of the covariates. Thus, the residuals represent the proportion of variance in the CVD risk factors that cannot be explained by the covariates. Subsequently, the residuals were used as covariate-independent CVD risk factors. $$y _{ i } = \,covariate_{1 i } + covariate_{2 i } + \ldots \,covariate_{ ni } + e \prime _{ i },(equation\,1) $$
-
(2) The residuals (covariate-independent CVD risk factors for women) were divided into quartiles.
-
(3) The HEI-10 score was devised for each quartile using the population ratio approach( Reference Freedman, Guenther and Krebs-Smith 38 ).
-
(4) A t test was conducted between the top and bottom quartiles, and the probability of difference was calculated under the normal distribution.
-
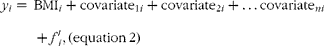
(5) For each CVD risk factor that showed significant differences in HEI-10 score between the top and bottom quartiles, the risk factor was then regressed for the covariates (ethnicity, education level, PIR, smoking, alcohol use, physical activity, menopausal status and BMI within women) using the linear regression model specified in equation 2:
where BMI i refers to the BMI for the ith individual and f′ i refers to the residuals of the CVD risk factor, which are independent of the covariates and BMI. Thus, the residuals for this step represent the proportion of variance in the CVD risk factors that cannot be explained by the covariates or BMI. Subsequently, these residuals were used as BMI and covariate-independent CVD risk factors.
$$y _{ i } = \,BMI_{ i } + covariate_{1 i } + covariate_{2 i } + \ldots \,covariate_{ ni } + f \prime _{ i },(equation\,2) $$
-
(6) The residuals (BMI- and covariate-independent CVD risk factors for women) were divided into quartiles.
-
(7) The HEI-10 score was devised for each quartile using the population ratio approach.
-
(8) A t test was conducted between the top and bottom quartiles, and the probability of difference was calculated under the normal distribution.
The analyses were subsequently repeated for men (without controlling for menopausal status or hormone therapy use), and the results are presented separately for men and women. A false discovery rate correction for multiple testing was applied to these analyses, and corrected Q-values were reported( Reference Benjamini and Hochberg 52 ).
Because the population ratio approach is recommended by the National Cancer Institute (NCI), we focus on this methodology. We provide results obtained without applying the population ratio approach in online supplementary Tables S3 and S4.
Results
Demographic characteristics are presented in Table 1. Lean v. obese status was associated with age, ethnicity, PIR, smoking and physical activity in men and women (all P= 0·006 to < 0·0001) as well as menopausal status in women (P< 0·0001). Education level was associated with lean v. obese status in women (P< 0·0001) but not men (P= 0·29), as was alcohol level (P< 0·0001 and P= 0·40, respectively).
Table 1 Demographic characteristics, lifestyle variables, smoking, alcohol use and CVD risk factors in the NHANES (National Health and Nutrition Examination Survey) study population between 2005 and 2010 (Mean values and standard deviations; number of participants and percentages)

NH, non-Hispanic; PIR, poverty:income ratio; PA, physical activity; MET, metabolic equivalents; HEI-10, Healthy Eating Index-2010; WC, waist circumference; SBP, systolic blood pressure; DBP, diastolic blood pressure; HOMA-IR, homeostatic model of insulin resistance; HDL-C, HDL-cholesterol; LDL-C, LDL-cholesterol; CRP, C-reactive protein.
* Normal weight was defined as BMI < 25 kg/m2; overweight/obese as BMI ≥ 25·0 (kg/m2).
† From a t test (continuous variables) or χ2 (categorical variables) test of mean differences within sex.
‡ The sd cannot be calculated for the population ratio, therefore se is provided for this variable only.
Associations between Healthy Eating Index-2010 score and covariate-adjusted CVD risk factors using the population ratio approach
When comparing the first and last quartiles of CVD risk factor for total HEI-10 score, dietary quality was not associated with the covariate-independent CVD risk factors SBP (Q= 0·17), DBP (Q= 0·32), fasting glucose (Q= 0·48), fasting insulin (Q= 0·17), HOMA-IR (Q= 0·11), HDL-C (Q= 0·26), TAG (Q= 0·11), LDL-C (Q= 0·83) and CRP (Q= 0·17) in women (Table 2). In men, dietary quality was associated with fasting insulin (Q= 0·001), HOMA-IR (Q= 0·001), HDL-C (Q= 0·01), TAG (Q= 0·04) and CRP (Q= 0·01) but not with SBP (Q= 0·19), DBP (Q= 0·19), fasting glucose (Q= 0·07) or LDL-C (Q= 0·48; Table 3).
Table 2 Healthy Eating Index-2010 score by quartiles of covariate-adjusted CVD risk factors* in women (Mean values with their standard errors)

SBP, systolic blood pressure; DBP, diastolic blood pressure; HOMA-IR, homeostatic model of insulin resistance; HDL-C, HDL-cholesterol; LDL-C, LDL-cholesterol; CRP, C-reactive protein.
* CVD risk factors score adjusted for age, ethnicity, education level, poverty:income ratio, smoking, alcohol use, physical activity and menopausal status.
† df are non-integers due a violation of the assumption of homogeneity associated with the variance–covariance matrix used in calculating the population ratio.
‡ P-values and Q-values calculated using the population ratio approach.
Table 3 Healthy Eating Index-2010 score by quartiles of covariate-adjusted CVD risk factors* in men using the population ratio approach (Mean values with their standard errors)

SBP, systolic blood pressure; DBP, diastolic blood pressure; HOMA-IR, homeostatic model of insulin resistance; HDL-C, HDL-cholesterol; LDL-C, LDL-cholesterol; CRP, C-reactive protein.
* CVD risk factors score adjusted for age, ethnicity, education level, poverty:income ratio, smoking, alcohol use and physical activity.
† df are non-integers due a violation of the assumption of homogeneity associated with the variance–covariance matrix used in calculating the population ratio.
‡ P-values and Q-values calculated using the population ratio approach.
§ Values are significant.
Associations between Healthy Eating Index-2010 score and BMI- and covariate-adjusted CVD risk factors using the population ratio approach
For those associations between HEI-10 and covariate-adjusted CVD risk factors, we additionally adjusted the risk factors for BMI. Subsequently, no associations between dietary quality and CVD risk factors remained statistically significant (all Q>0·10; Table 4). We also ran the associations with CVD risk factors adjusted for covariates and WC (but not BMI), because central adiposity is a CVD risk factor. We observed the same pattern of results (online supplementary Table S5).
Table 4 Healthy Eating Index-2010 score by quartiles of BMI- and covariate-adjusted CVD risk factors* in men using the population ratio approach (Mean values with their standard errors)
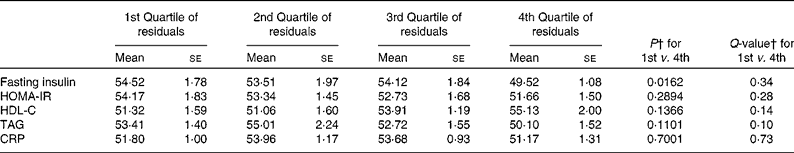
HOMA-IR, homeostatic model of insulin resistance; HDL-C, HDL-cholesterol; CRP, C-reactive protein.
* CVD risk factors score adjusted for BMI, and age, ethnicity, education level, poverty:income ratio, smoking, alcohol use and physical activity.
† P values and Q-values calculated using the population ratio approach.
Discussion
The goal of the present study was to use a large, nationally representative US dataset (NHANES) to examine whether any observed associations between dietary quality, as measured by the HEI-10, and CVD risk factors were attenuated when the association between BMI and CVD risk factors was taken into account. To our knowledge, this is the first study to use the population ratio approach to examine the association between CVD risk factors and HEI-10 as well as the first study to stratify such analyses by sex. No significant associations between dietary quality and CVD risk factors were seen in women, but in men overall, dietary quality was significantly associated with five CVD risk factors. However, these associations were attenuated and no longer significant when we statistically controlled for the effect of BMI on CVD risk factors.
Previous research has shown that dietary quality, as measured by the HEI, shows a weak association with CVD incidence( Reference McCullough, Feskanich and Stampfer 28 , Reference McCullough, Feskanich and Rimm 29 ) and mortality( Reference Reedy, Krebs-Smith and Miller 30 ) in both men and women. It is therefore not surprising that other research has associated dietary quality with the present panel of CVD risk factors( Reference Nicklas, O'Neil and Fulgoni 31 , Reference Ford, Mokdad and Liu 32 ). However, methodological advances in nutritional epidemiology since these studies were first published allow for confirmation of these findings. Such statistical improvements in the analysis address issues such as the use of intra-person analyses on 24-h recall data, which should be compared at the group level, and the difficulty in accounting for the underreporting of nutritional data, which varies by sex( Reference Mertz, Tsui and Judd 34 ). Specifically, the population ratio approach uses the ratio of nutrients to reported energy intake( Reference Freedman, Guenther and Krebs-Smith 38 ), and it is a modification of nutrient density models which correct food frequency data for reported energy. For these reasons, the population ratio approach is suitable for 24-h recall data( Reference Willett, Stampfer and Willet 36 ). Applying the population ratio approach resulted in small but important differences in the association between diet quality and CVD risk factors. For example, with the population ratio approach, HDL-C was not associated with dietary quality in women (P= 0·12), but without the population ratio approach, they were associated (P< 0·05). Similarly, when applying the population ratio approach, fasting DBP was not associated with diet quality in men (P= 0·30), but without that approach, they were associated (P= 0·01; Q= 0·04). The differences between the two approaches were not frequent enough and were not of a magnitude to draw consistent conclusions regarding the direction of effect for reducing bias in self-report nutrition data using the population ratio approach, and other studies should examine this in a more systematic manner. Using the population ratio approach, we report that HEI-10 score is associated with five known CVD risk factors: insulin, HOMA-IR, HDL-C, TAG and CRP in men. This confirms the well-known association between overall dietary quality (as defined by a number of indices) and numerous health indicators, including markers of inflammation, lipid parameters and insulin axis measures( Reference Nicklas, O'Neil and Fulgoni 31 , Reference Obarzanek, Sacks and Vollmer 53 – Reference Fung, McCullough and Newby 55 ).
In the present analyses, HEI-10 score was not associated with blood pressure or LDL-C. Although this is contrary to one previous report that used NHANES data( Reference Nicklas, O'Neil and Fulgoni 31 ), the present finding is in line with the larger body of literature that largely centres on reducing Na or adhering to the Dietary Approaches to Stop Hypertension diet( Reference Sacks, Svetkey and Vollmer 57 , Reference Bray, Vollmer and Sacks 58 ). This literature shows only a very moderate association between diet and blood pressure( Reference Drewnowski, Fiddler and Dauchet 56 ). Because the HEI does not specifically measure Dietary Approaches to Stop Hypertension dietary recommendations, it is entirely plausible that HEI adherence is not associated with improved hypertension. Indeed, in the previous HEI/NHANES report, only SBP (not DBP) was significantly associated with overall HEI score, and it was only associated between the first and second quartiles of HEI intake, not overall( Reference Nicklas, O'Neil and Fulgoni 31 ). This may highlight the importance of using statistical approaches designed for the type of nutritional data collected. The present study therefore adds weight to a growing body of literature which suggests that general diet quality recommendations are not associated with blood pressure.
It was surprising that no significant associations were observed between dietary quality and CVD risk factors in women, although we did find one report of a similar pattern of results with a French sample that also used the HEI( Reference Drewnowski, Fiddler and Dauchet 56 ). Other lifestyle behaviours, such as screen time, show sex-specific associations with CVD risk factors( Reference Frazier-Wood, Borecki and Feitosa 59 , Reference Wijndaele, Healy and Dunstan 60 ), and it has been suggested that other correlates of sex, such as smoking rates and alcohol intake, might account for differences, which would indicate a ceiling effect to CVD risk. This suggests that work needs to be done in this area with more careful matching between men and women on background characteristics. Furthermore, the need to conduct sex-stratified analyses on CVD risk is highlighted. If the results from the present study and those of Drewnowski et al. ( Reference Drewnowski, Fiddler and Dauchet 56 ) in France are replicated, there could be important public health implications for devising sex-sensitive strategies to prevent CVD risk. It is important that work is conducted to replicate the results in the present study and to explain the physiology underlying these findings.
For the first time, we show that associations between dietary quality and CVD risk factors are attenuated when accounting for the effect of BMI on CVD risk factors. Previous analyses have controlled for BMI; however, they have not explicitly compared associations between BMI-adjusted and BMI-unadjusted risk factors( Reference Nicklas, O'Neil and Fulgoni 31 ). In the present study, the associations (all Q< 0·04) were no longer significant after we controlled for BMI (all Q≥ 0·10). Although the population ratio approach, which is necessary to achieve the most accurate analysis of 24-h self-report nutrition data, negates the possibility of an explicit comparison of effect sizes, as is the case with a Sobel test, it is clear that the associations are dramatically attenuated when controlling for BMI. Before controlling for BMI, there is an average of 9 HEI-10 points between the top and bottom quartiles for each significant risk factor. After controlling for BMI, this drops to a 3·2-point difference. This suggests that dietary quality may not be associated with CVD risk factors in men over and above the association of BMI with CVD risk factors. Whether this implies that BMI is a more suitable target for intervention than dietary quality when attempting to reduce CVD risk requires further analysis. We are not aware of any intervention trials which target diet quality and successfully modify CVD risk factors but examine the effects independent of BMI changes( Reference Yu-Poth, Zhao and Etherton 61 ). This is likely because BMI and central obesity are considered correlates of CVD risk. Although the findings in this study need replication and examination in interventions, at this stage the results suggest that BMI is a worthwhile target for reducing CVD risk.
There are clear limitations for the present study. First, its cross-sectional nature makes causal inferences and inferences regarding the effect of interventions on CVD risk factors impossible. Second, dietary data was self-reported, not measured, but it did directly follow the 24-h recall period. Although HEI is correlated with several biological markers of nutritional intake( Reference Hann, Rock and King 62 , Reference Weinstein, Vogt and Gerrior 63 ), and although we employed a statistical approach that has been shown to minimise underreporting and bias in self-report dietary data( Reference Willett, Stampfer and Willet 36 , Reference Freedman, Guenther and Krebs-Smith 38 ), it is likely that the present models subsume error and other sources of variability. As such, we focus on the overall patterns of results, and not on specific parameter estimates. Third, the HEI was not developed specifically for the prevention of CVD. Therefore, it is not a very sensitive measure of the potential for diet to affect CVD risk; for example, grains are not differentiated into refined and unrefined, which would show differential associations with CVD risk factors( Reference Wirt and Collins 26 ). Finally, the HEI is only one measure of dietary quality that reflects adherence to the Dietary Guidelines for Americans; other measures should be explored for sex- or risk factor-specific associations.
Despite these limitations, we used the population ratio approach to examine whether dietary quality, as measured by overall HEI-10 score, is associated with CVD risk factors and whether any associations can be attributed to BMI. We corroborate previous findings that dietary quality is associated with HOMA-IR, insulin, HDL-C, TAG and CRP in men, but we cannot support its association with blood pressure and LDL-C. Furthermore, we provide the second report that HEI-assessed dietary quality is not associated with CVD risk factors in women( Reference Drewnowski, Fiddler and Dauchet 56 ), which highlights a sex-specific association between dietary quality and CVD risk. Finally, we show that any significant associations in men are attenuated to non-significance when statistically controlling for the effect of BMI on CVD risk factors. In sum, the present study offers several insights for understanding the association between CVD risk and diet, including the importance of using careful statistical approaches in the analysis of dietary data and examining the potential for CVD risk factors to be sex specific. Furthermore, previous research has established that BMI is a key correlate of CVD risk, and the present study uniquely suggests that BMI is a CVD risk factor over and above dietary quality. We encourage future trials to examine whether this has clinical relevance by assessing the effect of intentionally reducing BMI on CVD risk factors without adding any further intervention aimed to improve dietary quality.
Supplementary material
To view supplementary material for this article, please visit http://dx.doi.org/10.1017/S0007114515000185
Acknowledgements
A. C. F.-W. is funded by the American Heart Association (grant no: 14BGIA18740011) and the USDA/ARS Children's Nutrition Research Center at Baylor College of Medicine. This work is a publication of the USDA/ARS Children's Nutrition Research Center, Department of Pediatrics, Baylor College of Medicine, Houston, TX, and it is funded in part with federal funds from the USDA/ARS under Cooperative Agreement No. 309-5-001-058. The contents of this publication do not necessarily reflect the views or policies of the USDA, nor do the mention of trade names, commercial products or organisations imply endorsement from the US government. We thank Hwa Young for her assistance with data management and with statistical programming.
All authors report no conflicts of interest.
A. C. F.-W. formulated the research question, designed the analysis and wrote the article; J. K. conducted data analysis; J. K., J. S. D. and S. C. helped design the statistical analyses. In addition, all authors reviewed the final manuscript.


