


INTRODUCTION
Coffee agroforests have been cited as agro-ecosystems that mimic natural forest because of their multiple layers of potential habitat and complementary interactions amongst tree, crop and animal species, above and below ground (Jha et al., Reference Jha, Bacon, Philpott, Méndez, Läderach and Rice2014). In Kenya, there is evidence of declining tree species diversity on coffee farms (Carsan et al., Reference Carsan, Stroebel, Dawson, Kindt, Swanepoel and Jamnadass2013; Kehlenbeck et al., Reference Kehlenbeck, Kindt, Sinclair, Simons and Jamnadass2011; Pinard et al., Reference Pinard, Joetzjer, Kindt and Kehlenbeck2014), reflecting global trends which are anticipated to affect the ecosystem services they provide, including pollination, pest control, climate regulation and nutrient sequestration and cycling (Jha et al., Reference Jha, Bacon, Philpott, Méndez, Läderach and Rice2014). The steep rank abundance curves for tree species on Kenyan coffee farms (Pinard et al., Reference Pinard, Joetzjer, Kindt and Kehlenbeck2014) that result in the predominance of a few exotic species, is consistent with farmers deliberately planting or retaining trees promoted by extension services, as recently documented in Latin America (Valencia et al., Reference Valencia, West, Sterling, Garcıa-Barrios and Naeem2015).
There has been scant consideration in the scientific literature of farmers’ knowledge and the real-world constraints that inform the decision-making underpinning which trees are planted or retained on Kenyan coffee farms (Carsan et al., Reference Carsan, Stroebel, Dawson, Kindt, Swanepoel and Jamnadass2013). Studies that have explored local knowledge of coffee shade trees in specific locations in Latin America have revealed that farmers have detailed understanding of tree–crop interactions and forest succession but did not investigate how consistently this knowledge was held across sites (Cerdán et al., Reference Cerdán, Rebolledo, Soto, Rapidel and Sinclair2012; Soto-Pinto et al., Reference Soto-Pinto, Villalvazo-Lo´pez, Jime´nez-Ferrer, Ramı´rez-Marcial, Montoya and Sinclair2007). Systematic studies of local knowledge about cocoa (Anglaaere et al., Reference Anglaaere, Cobbina, Sinclair and McDonald2011), coffee (Cerdán et al., Reference Cerdán, Rebolledo, Soto, Rapidel and Sinclair2012) and fodder tree agroforestry (Thapa et al., Reference Thapa, Sinclair and Walker1995) have all revealed that farmers recognise tree attributes. These include attributes like rooting depth and spread, and crown density, which affect tree–crop interactions, as well as productive attributes like medicinal, timber and firewood values. Previous work has not, however, explored whether knowledge about tree attributes is consistent amongst farmers across sites with the notable exception of local descriptors of fodder value that were found to be consistently used across a landscape in Nepal (Walker et al., Reference Walker, Thorne, Sinclair, Thapa, Wood and Subba1999) and to correspond to sophisticated scientific assessments of fodder quality (Thorne et al., Reference Thorne, Subba, Walker, Thapa, Wood and Sinclair1999). We are applying a novel approach of using an explicit probability model (Smith Dumont et al., in press) to assess whether coffee farmers’ knowledge of tree attributes was consistent enough across sites along an altitudinal gradient in Kenya to:
1. explain the species that farmers retained or planted on their coffee farms, and
2. inform the promotion of tree diversity in coffee landscapes, commensurate with maintaining the provision of ecosystem services and the resilience of coffee dominated landscapes.
Data were collected by systematic acquisition of farmers’ knowledge about tree–crop interactions and the utility of trees on their farms from a small purposive sample of famers, followed by ranking of different tree species for key attributes using a separate stratified random sample of farmers.
MATERIALS AND METHODS
Study site
Research was conducted in Nyeri and Murang'a Counties of the Central Highlands of Kenya. The area was selected because of its proximity to the Aberdare Forest Reserve, a biodiversity hotspot, and its high densities of smallholder coffee farms with shade tolerant Coffea arabica varieties. Coffee fields are generally small, typically 0.4–1.2 ha (NEMA, 2007), and there is extensive tree cover across the landscape mainly comprising trees along plot boundaries (Figure 1).

Figure 1. These photographs (a) depict the typical landscape features of the research area, with steeply undulating hills and mixed farming systems, and (b) show the most common tree on farms, Grevillea robusta growing with Coffea arabica.
Local knowledge acquisition
Local knowledge of farmers was acquired using the Agro-ecological Knowledge Toolkit (AKT) knowledge-based systems methodology (Sinclair and Walker, Reference Sinclair and Walker1998; Walker and Sinclair, Reference Walker and Sinclair1998) and software (Kendon et al., Reference Kendon, Walker, Robertson, Haggith, Sinclair and Muetzelfeldt1995).
In the first ‘scoping’ stages of research, a range of stakeholders involved with coffee farming, including smallholder farmers, coffee estate owners and coffee factory chairmen, were interviewed in order to gain a broad overview of the research context. This involved 17 interactions with 20 people in a combination of individual interviews and focus group discussions.
The information gained from these scoping meetings enabled the researchers to define the knowledge domain and sampling strategy. Two separate knowledge bases (KBs) were then developed: one focused on coffee farming practices and their impact on biodiversity and the other on the utilities of trees that coffee farmers retained or planted on their farms. The overarching focus was smallholder farmers’ explanatory knowledge underlying the retention or planting of tree species within coffee farming systems, relationships between these species and the wider environment, including the provision of ecosystem services. Analysis of the acquired knowledge was carried out using a suite of automated reasoning procedures in AKT5.
A purposive sample of farmers was used to compile the KBs, stratified according to altitude (location) and farm size with a minimum of five informants per stratum (Walker and Sinclair, Reference Walker and Sinclair1998) resulting in a total sample size of 65 farmers across eight divisions (administrative level below sub-county) spanning an altitudinal range of 1200 m to 2000 m. Farmers were selected for the compilation stage on the basis of their willingness to take part and their knowledge about coffee farming deduced from the scoping stage. Repeated semi-structured interviews, coupled with representation of knowledge using the AKT restricted syntax, were used to acquire knowledge.
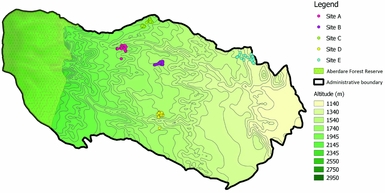
The consistency of farmers’ knowledge about tree attributes was then evaluated across Murang'a County using a ranking survey administered to a stratified random sample of 125 smallholder farmers in five locations ranging in elevation from 1200 m to 1920 m (Figure 2). Farmers were randomly selected from coffee factory lists at each site.
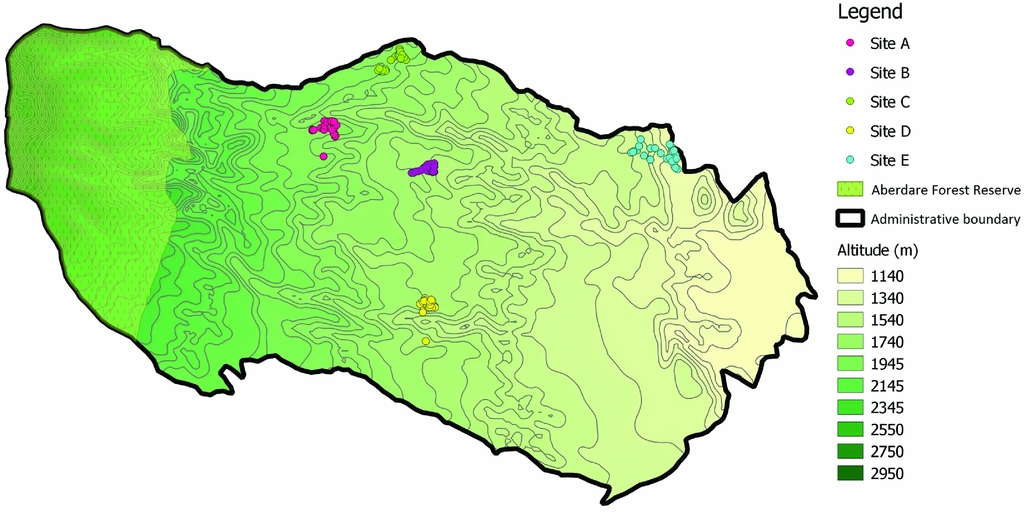
Figure 2. Map of the farms in Murang'a County in Central Kenya, where the tree attribute ranking survey was administered. To the far left is the Aberdare Forest Reserve.
The ranking survey comprised the ranking of 29 species in relation to 12 attributes. The attributes were derived from the KBs and included nine attributes that farmers said were important in influencing tree crop interactions: (1) crown spread, (2) crown density, (3) easiness to prune, (4) growth after pruning, (5) rooting depth, (6) rooting spread, (7) tree growth rate, (8) leaf decomposition rate and (9) leaf benefit to the soil when used as mulch; and three attributes related to farmer evaluation of the utility of tree products: (10) burn length of wood from firewood trees, (11) strength of wood and (12) durability of wood from timber trees.
There were 100 tree species on farms identified from combining the results of the local knowledge research and a tree inventory carried out on 62 coffee farms in Murang'a County in 2010 (Pinard et al., Reference Pinard, Joetzjer, Kindt and Kehlenbeck2014). Information on tree attributes, species diversity, abundance and positioning on farms was gathered from 127 farms in total. Tree species for inclusion in the survey were identified by cross referencing data from these sources. Only trees that appeared along boundaries and physically within coffee plots were selected for ranking (Table 1). Trees that had a low abundance were not included; this was to avoid trees being ranked too few times against the other trees to be statistically meaningful. This resulted in 29 tree species being included in the ranking survey.
Table 1. Tree species included in the tree attribute ranking survey, the ecosystem services that farmers reported for them, where they were positioned on coffee farms, and their abundance based on an inventory of 62 farms (Pinard et al., Reference Pinard, Joetzjer, Kindt and Kehlenbeck2014). All the trees were recorded in the knowledge bases except Ehretia cymosa which was included in the ranking survey since it was neither rare nor unevenly distributed from the inventory data.
As it was not feasible to ask farmers to rank too many trees, following pre-testing of ranking exercises, each farmer was asked to rank 10 species (selected from the list of 29) for all 12 attributes. This resulted in the ranking typically taking about 60 minutes. Farmers were only asked to rank species that they had direct experience with and declined to rank some species for some attributes because they considered them not relevant to that tree. This resulted in different numbers of species being ranked for different attributes, ranging from 28 trees for crown attributes, to 12 trees for timber quality.
Analysis of ranked data
The tree attribute ranking survey generated a complex data set comprising up to 125 different combinations of species (each comprising 10 of the 29 in the survey) ranked by farmers for up to 12 different attributes. The BradleyTerry2 package (BTm) in R was used (Turner and Firth, Reference Turner and Firth2012) to analyse these data. Each attribute was analysed separately. In the context of our paper, the BTM model estimates the likelihood that farmers perceive one tree to be better than another tree with respect to the attribute in question. It thus allows estimation both of the precision as well as the consistency of qualitative ranking data (Smith Dumont et al., in press). Grevillea robusta was chosen as the benchmark against which all other trees are compared, as it was the most frequently ranked tree for all attributes. To allow comparisons between any tree pair and not only between individual trees and the benchmark the quasivariance of the estimates was used as a measure of uncertainty, rather than the default standard errors (Gayle and Lambert, Reference Gayle and Lambert2007). The quasivariance was calculated using the qvcalc package (Firth and Menezes, Reference Firth and de Menezes2004). Estimation of the Bradley–Terry model in BTm is by default computed by maximum likelihood, using an internal call to the glm function, when there are no random effects in the model. When numbers or comparisons of some species are low the bias in maximum likelihood estimates can be large, so the model was fitted with bias-reduced maximum likelihood (Firth, Reference Firth1993), using the package brglm (Kosmidis, Reference Kosmidis2007).
RESULTS AND DISCUSSION
The farmer KBs comprised a total of 959 unitary statements representing farmer knowledge about coffee agroforestry, with the majority (73%) causal statements that are explanatory in nature and derived from direct observation by farmers. This represents the knowledge of 74 interviews with 65 informants and three group feedback sessions where more knowledge was elicited when groups discussed the knowledge that had been recorded in the KBs.
Managing the coffee plot for ecosystem services
A recurring theme from interviews was that while extension advice and factory regulations stipulated that coffee should not be grown under shade or intercropped, in reality this was common practice. There were many trees grown either on boundaries or directly within coffee plots (Table 1) and their abundance varied according to the livelihood needs of the farmer and space on the farm.
Coffee was a major cash crop in the area relied on for paying school fees. When there was a drop in market prices, farmers were driven to diversify what was grown on their land in order to make up for the shortfall. During interviews, it was explained that the options were either to intercrop and continue getting something of value from the coffee plots or replace coffee completely with another cash crop. Despite very low prices for coffee at the time interviews were conducted, farmers reported being reluctant to uproot coffee because the price might rise again. By incorporating food crops and multi-purpose trees into their coffee plots, farmers were ensuring alternative livelihood strategies in the face of market fluctuations. This situation is mirrored in other coffee growing regions across the World as a way of managing risk and maintaining household food security (Schroth and Ruf, Reference Schroth and Ruf2014). These findings compare with research in Southern Colombia (Bosselman et al., Reference Bosselmann, Dons, Oberthur, Olsen, Ræbild and Usma2009) and Costa Rica (Cerdán et al., Reference Cerdán, Rebolledo, Soto, Rapidel and Sinclair2012) where it was found that farmers weigh shading effects on coffee productivity and quality against the multiple products and services provided by shade trees. Factors that influence tree crop diversification are complex (Schroth and Ruf, Reference Schroth and Ruf2014), but without planned diversification and abundance at a landscape scale there is the probable outcome – as demonstrated in Central Kenya – of a few species dominating the agricultural landscape. When functional diversity is lost, there can be major impacts on ecosystem service delivery and increased vulnerability (Ordonez et al., Reference Ordonez, Luedeling, Kindt, Tata, Harja, Jamnadass and van Noordwijk2014).
Farmers linked shade with a decrease in temperature of coffee plots and increased humidity which they said increased the risk of fungal diseases like coffee berry disease caused by Colletotrichum kahawae and coffee leaf rust caused by Hemileia vastatrix (Figure 3). This concurs with scientific findings that the risk of coffee rust is heavily influenced by climate, especially rainfall distribution and amount (Avelino et al., Reference Avelino, Willocquet and Savary2004). Despite this, shade in coffee plots was recognised by farmers as beneficial during hot and sunny spells; with examples given of coffee trees next to Musa sapientum and G. robusta retaining a healthy dark green colour to their leaves during these times. A comparison of the statements contained in the KBs according to elevation, demonstrate that dense shade and a resulting decrease in coffee plot temperature were identified as being more problematic at higher elevation, while shade at lower elevations was acknowledged for its importance in protecting coffee trees from high temperatures and sun damage. It was farmers at lower elevations who also observed that the presence of shade trees decreases coffee pest abundance (specifically thrips and leaf miner). At higher elevations, specific shade trees were identified as attracting coffee pests; for example, Bridelia micrantha and Kigelia africana were said to attract boring insects to coffee plots.
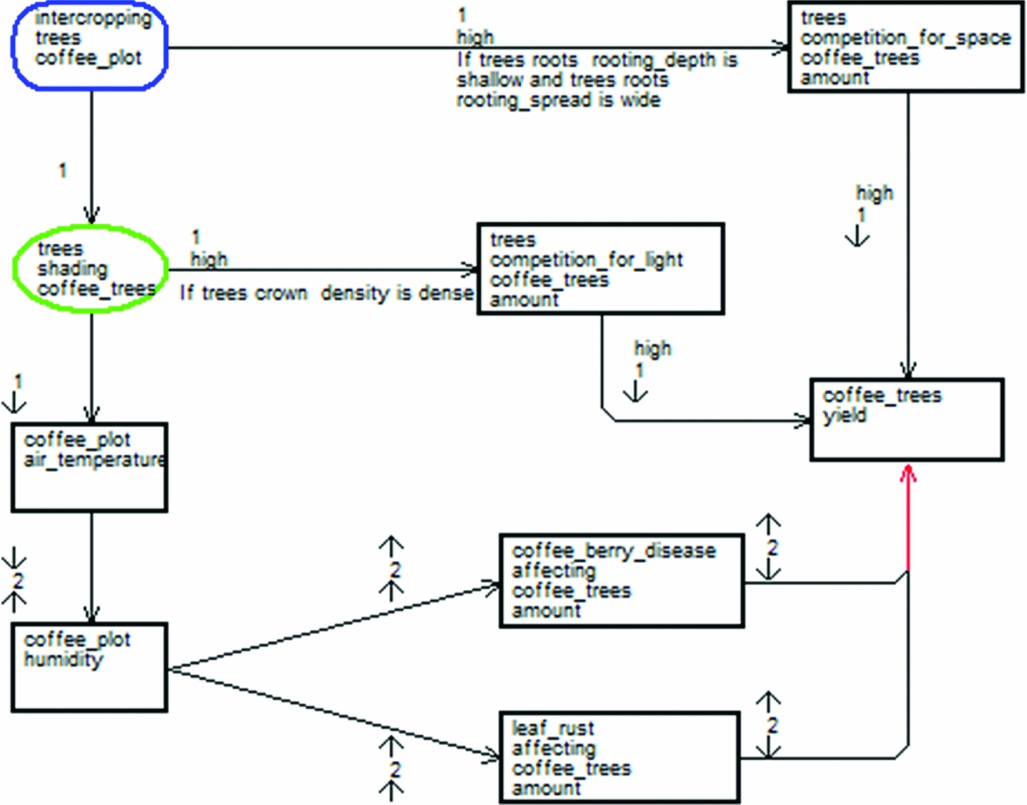
Figure 3. Causal diagram showing farmers’ knowledge about the effects that shade trees can have on microclimate, disease occurrence and coffee yield. Legend: Nodes represent human actions (boxes with rounded corners), natural processes (ovals) or attributes of objects, processes or actions (boxes with straight edges). Arrows connecting nodes denote the direction of causal influence. The first small arrow on a link indicates either an increase (↑) or decrease (↓) in the causal node, and the second arrow on a link refers to an increase (↑) or decrease (↓) in the effect node. Numbers between small arrows indicate whether the relationship is two-way (2), in which case ↑A causing ↓B also implies ↓A causing ↑B, or one-way (1), which indicates that this reversibility does not apply. Words instead of small arrows denote a value of the node other than increase or decrease (e.g. when trees competition_for_space with coffee_trees is high, there is a decrease in coffee_trees yield).
In the wider scientific literature, there are disputes about whether shading has an impact on incidence of coffee pests (Beer et al., Reference Beer, Muschler, Kass and Somarriba1998; Bosselmann et al., Reference Bosselmann, Dons, Oberthur, Olsen, Ræbild and Usma2009; Soto-Pinto et al., Reference Soto-Pinto, Perfecto and Caballero-Nieto2002; Staver et al., Reference Staver, Guharay, Monterroso and Muschler2001), but it appears to be very context specific – dependant on the mix and density of shade trees, as well as biophysical environment variability. Bosselmann et al. (Reference Bosselmann, Dons, Oberthur, Olsen, Ræbild and Usma2009) found a higher occurrence of berry borer under shade in Colombia but emphasise the importance of elevation and exposure. They also make the important point that moderate shade from solitary trees will have a different effect than dense shade within multi-strata coffee agroforests, because at low tree densities biological control agents may not have a high enough abundance to control insect pests on the coffee bushes (Beer et al., Reference Beer, Muschler, Kass and Somarriba1998; Bosselmann et al., Reference Bosselmann, Dons, Oberthur, Olsen, Ræbild and Usma2009).
Farmers at all elevations said that they were compromising coffee yield when growing it with other trees because of the competition for light, nutrients, water and rooting space (Figure 3). The physical attributes of intercropped trees that were said to influence the level of shade were crown density and spread, while rooting depth and spread influenced below-ground competition for space, nutrients and water. Additionally, damage to coffee trees could occur from falling branches, falling debris during shade tree pruning and accumulated water falling from the tree crowns. It was recognised that these negative effects on coffee productivity could be minimised through appropriate management, with wide spacing between intercropped trees, extra manure and/or chemical fertiliser application and regular pruning of trees with large crowns. This is in agreement with scientific recommendations (Beer, Reference Beer1987) but was often not translated into practice because of the cost and labour involved. There was a lack of detailed knowledge about how to manipulate the coffee agro-ecosystem through root and branch pruning.
Farmers mainly planted or retained trees on their farms if they perceived them as beneficial in terms of short- and mid-term provisioning services such as: fruit, firewood, timber and livestock fodder for domestic use and cash income. Although it was apparent that decisions were not based on the regulating services that trees could provide within coffee systems, farmers expressed an awareness of these aspects, with many native trees said to ‘bring the rains’ and others valued for their positive impacts on soil fertility and erosion, as well as high value long term provisioning services such as timber and charcoal production (Table 1). Despite farmers’ positive association of native trees with a healthy environment, they were at low abundances on most farms (Kehlenbeck et al., Reference Kehlenbeck, Kindt, Sinclair, Simons and Jamnadass2011; Pinard et al., Reference Pinard, Joetzjer, Kindt and Kehlenbeck2014). During interviews, farmers attributed the disappearance of native trees from farming landscapes to deforestation during the 1980s for charcoal, construction timber and firewood and increased demand for agricultural land associated with population growth. A common reason given for not retaining more native trees on farms was their slow growth rate and the space they take up. As a result of customary inheritance in the area, farms were being subdivided into ever smaller parcels, making it increasingly difficult for farming to remain profitable. It was not seen as economically viable to have trees taking up space unless there were tangible benefits to livelihoods.
Introduced trees that farmers said were present in high numbers on farms were G. robusta, Acacia mearnsii, Macadamia tetraphylla, Psidium guajava, Persea americana and Eucalyptus spp. (Table 1), findings supported by tree inventories (Pinard et al., Reference Pinard, Joetzjer, Kindt and Kehlenbeck2014 and Kehlenbeck et al., Reference Kehlenbeck, Kindt, Sinclair, Simons and Jamnadass2011). According to those interviewed, the only tree that was recommended by coffee factories for intercropping with coffee was G. robusta because it was reported not to adversely affect the growth of coffee. It was introduced to Central Kenya from Australia as a coffee shade tree which explains its acceptance and dominance in the area. Although G. robusta was the only recommended shade tree, as discussed above, many farmers had other trees present in their coffee plots to meet their various needs.
There was strong agreement by farmers that land was drying up because of the large numbers of eucalypts, understood to use a lot of water and nutrients and so to be unsuitable for combining with crops, consistent with the scientific literature (Kuyah et al., Reference Kuyah, Muthuri and Ong2009). Because of this, Eucalyptus spp. were not commonly grown in coffee plots and farmers usually restricted them to woodlots and boundaries.
Farmer ranking of tree attributes
Farmers were able to rank trees against one another for a range of attributes but the precision of farmers’ ranking of trees varied both by attribute as well as tree species. While there was a clear order of tree species, lack of consistency in ranking of some species for some attributes, that had been ranked only a few times, such as Sapium ellipticum resulted in large standard errors that prevented their clear separation from other trees (Figures 4–6). Ranking of some attributes produced more distinct groupings of trees than others, according to how well farmers could distinguish between trees for the attribute in question. Interestingly, despite Commiphora zimmermannii’s high proportional abundance (Table 1), it was not ranked as frequently as some less abundant trees, only 20 times for rooting depth and 31 times for rooting spread. Farmers explained that this native tree has been retained on farms since colonial times and is considered a ‘peaceful’ tree, meaning that it does not compete heavily with crops around it. It was consistently ranked as a sparse and narrow crowned tree (Figure 4) with a narrow and shallow root system (Figure 5). It is mainly found on field boundaries, is primarily used for fodder and fencing (Table 1) and easily propagated through cuttings, consistent with the technical literature (Maundu and Tengnäs, Reference Maundu and Tengnäs2005).

Figure 4. Trees ranked against one another for (a) crown spread, from widest on the left to narrowest on the right, and (b) crown density, from least dense on the left to most dense on the right. Tree acronyms are given in Table 1.
Figure 5. Trees ranked against one another for (a) rooting depth, from deepest on the left to shallowest on the right and (b) rooting spread, from widest on the left to narrowest on the right. Tree acronyms are given in Table 1.
As a result of fluctuating coffee prices, some farmers were growing trees with dense and wide spreading crowns that were perceived to compete with coffee but, nevertheless, provide important supplementary income. This was primarily the case for avocado (P. americana) and mango (Mangifera indica) (Figure 4) indicating key trade-offs made by individual farmers with respect to coffee productivity versus product diversification.
Farmers suggested that deeper rooting was valued because it was generally associated with less competition with coffee. During the dry season, deep roots were also said to draw up water benefiting crops nearby, consistent with the scientific literature on hydraulic lift (Bayala et al., Reference Bayala, Heng, van Noordwijk and Ouedraogo2008). Results from the ranking survey, however, indicate that root depth and spread need to be considered together with Eucalyptus spp., ranked as having the widest as well as the deepest root system and considered very competitive and C. zimmermannii that though one of the shallowest rooting trees, was also the narrowest and considered compatible with coffee (Figure 5). Eucalyptus spp. was also ranked lowest for leaf benefit to soil (Figure 6) commensurate with its reported allelopathy. This demonstrates the importance of considering composite attributes of trees, such as their overall compatibility with crops. Farmers elsewhere have been found to classify trees according to composite attributes such as rhukhopan (combining above and below ground interactions of fodder trees with crops) in Nepal (Thapa et al., Reference Thapa, Sinclair and Walker1995) and the fresh and hot classification of shade trees combined with coffee in Costa Rica (Cerdán et al., Reference Cerdán, Rebolledo, Soto, Rapidel and Sinclair2012).
Figure 6. Trees ranked against one another for (a) leaf decomposition rate, from fastest on the left to slowest on the right and (b) leaf benefit to soil, from most beneficial on the left to least beneficial on the right. Tree acronyms are given in Table 1.
Farmers were able to rank trees against rooting spread more readily than rooting depth because they encountered the lateral roots frequently during cultivation whereas the rooting depth was known only if they had experience of digging the tree up and/or making charcoal from the tap root. Scientific data and detailed local knowledge on rooting characteristics is notoriously scarce (Reubens et al., Reference Reubens, Moeremans, Poesen, Nyssen, Tewoldeberhan, Franzel, Deckers, Orwa and Muys2011; Sinclair and Joshi, Reference Sinclair, Joshi and Lawrence2000) and, in this case, there were 15 trees out of 29 ranked 20 times or more for rooting depth and 17 for rooting spread. The trees ranked the most times (more than 60) for rooting depth were Eucalyptus spp. and G. robusta, whilst for rooting spread it was Eucalyptus spp., G. robusta, A. mearnsii, Cordia africana, Croton megalocarpus and P. americana.
Farmers identified trees that could be used to improve soil fertility in place of expensive fertilisers and gave the following species as useful for retaining soil nutrients and/or moisture: Calliandra calothyrsus, Dovyalis caffra, C. africana, Neoboutonia macrocalyx and Acokanthera oppositifolia. Only two of these species, C. africana and N. macrocalyx, were abundant enough to include in the ranking exercise, and both had leaves that were ranked as having a relatively fast decomposition rate and contributing highly to the fertility of the soil (Figure 6). There is little information available on N. macrocalyx in the scientific literature but C. africana is known for providing good mulch material in shaded coffee systems (Derero et al., Reference Derero, Gailing and Finkenldey2011). Farmers stated that mulching helped to maintain soil moisture, soil quality including the amount of humus and decreased weed growth.
It was clear that farmers had explanatory knowledge about the interactions between specific tree species and coffee, but it was not possible to clearly link individual attributes to competitiveness with coffee. For example, there was a general consensus that Eucalyptus spp., A. mearnsii and Cupressus lusitanica adversely affected coffee productivity so they were restricted to boundaries or woodlots rather than being incorporated in coffee plots, but for some attributes these trees were not distinguishable from trees like G. robusta that were considered suitable to grow with coffee. This may suggest that G. robusta is considered compatible with coffee because of extension advice rather than farmer experience as reported with Inga spp. in Mexico (Valencia et al., Reference Valencia, West, Sterling, Garcıa-Barrios and Naeem2015), possibly enhanced by farmers trading-off the value of the wood it produces. The lack of a local classification of trees in terms of a composite attribute describing compatibility with coffee, or crops more generally, as found elsewhere (Cerdán et al., Reference Cerdán, Rebolledo, Soto, Rapidel and Sinclair2012; Thapa et al., Reference Thapa, Sinclair and Walker1995), may reflect the history of growing coffee in Kenya which, until recently, largely excluded trees from coffee plots.
CONCLUSION
Detailed local knowledge acquisition from a small purposive sample revealed that the main criteria farmers in Central Kenya used in deciding whether a tree was suitable for intercropping with coffee were: crown width and crown density (heavy shade was perceived as undesirable), rooting depth and rooting spread (shallow and wide roots were undesirable), and importantly the perceived value of the products derived from the tree. Using a novel application of the Bradley–Terry model to test elements of these selection criteria on a larger stratified random sample, we found that coffee farmers’ knowledge of tree attributes affecting tree–crop interactions were generally consistent along an altitudinal gradient. There was varying depth in farmers knowledge about tree attributes depending on their experience with different species and how directly observable different attributes were, but it was possible to derive useful information about a range of tree attributes from farmers, for many more species than it would be feasible to measure directly.
Coffee farms in Kenya harbour a diverse mix of tree species but most are at low abundance and may not, therefore, be sustainable components of the landscape. Raising awareness amongst those advising farmers, that diverse tree cover can be compatible with coffee productivity and confer livelihood benefits from diversification and the provision of ecosystem services, would be a logical first step in promoting tree diversity that would ultimately lead to greater livelihood and landscape resilience. Farmers could clearly benefit from more detailed knowledge of how to manipulate tree–crop interactions through crown pruning, but this requires the development of context specific recommendations on suitable tree species, densities and management for farms at different altitudes. Given that each farmer only knows about some species, sharing collated local knowledge from across the region through farmer networks could enrich the knowledge available to farmers when making decisions to plant or retain trees on their coffee farms.
Acknowledgements
This research would not have been possible without the participation of farmers in Nyeri and Murang'a Counties so we thank them for their time and allowing us on their farms. This study was part of the project ‘Connecting, enhancing and sustaining environmental services and market values of coffee agroforestry in Central America, East Africa and India’ (CAFNET) financed by the European Commission Program on Environment in Developing Countries (EuropeAid/121998/C/G) and forms part of the CGIAR research programme on Forests, Trees and Agroforestry. We appreciate the support of colleagues at CIRAD, CRF, KENVO and Mugama Coffee Union. Data collected by Martha Njoroge, Stephen Muchoki, Ambrose Mwaniki, Emilie Joetzjer, Edith Gathoni and Nelson Muiru informed the research. Thanks to Emilie Smith Dumont for her useful comments on the first drafts of the paper and Ric Coe for his valuable input on the ranking analysis methods.


 Open access