INTRODUCTION
Healthcare-associated infections (HAIs) are associated with an increase in morbidity, mortality, length of hospital stay, and healthcare costs that would normally not be associated with the underlying disease [Reference Rosenthal1–Reference Higuera3]. Many cases can be avoided by the application of careful infection prevention activities as described in ‘Strategies to prevent ventilator-associated pneumonia in acute care hospitals’ published in 2008 by the Society for Health Epidemiology of America [Reference Coffin4]. These programmes are costly to implement, but building a strong economic argument about the cost savings from prevention is important to influence policy makers and budget managers in health. Health benefits are also enjoyed as mortality risk is reduced and infection-related morbidity avoided among patients. Effective infection prevention will incur a cost but lead to cost savings and will also generate health benefits [Reference Graves5, Reference Graves, Halton and Lairson6].
Ventilator-associated pneumonia (VAP) is a common problem in hospitals and the consequences are often serious. The economic arguments for prevention are more important when competition for scarce resources is high and this is the case in lower- and middle-income settings [Reference Rosenthal7, Reference Rosenthal8]. The aim of this study is to determine values for two important parameters in the economic decision-making process, excess length of stay (LoS) and mortality risk. This does not complete the full economic argument for investing in prevention activities, but instead provides valuable information for that argument. Data collected from intensive-care units (ICUs) in lower- and middle-income countries were used for this analysis. The research literature is sparse in these settings and this work is novel.
METHODS
We aimed to estimate the impact of infection on both LoS and risk of death. Infection is a time-dependent variable, and it is therefore essential to use statistical methods that correctly account for this, otherwise estimates are inevitably biased [Reference Beyersmann, Wolkewitz and Schumacher9–Reference Crnich11]. To avoid any biases when estimating the extra LoS due to infection we used the methods described in Allignol et al. [Reference Allignol, Schumacher and Beyersmann12], and to estimate the unbiased risk of mortality due to infection we used the sub-distribution hazards approach described in Beyersmann & Schumacher [Reference Beyersmann and Schumacher13].
Both methods arrange the data according to the multi-state format shown in Figure 1. A patient enters the ICU and becomes susceptible to infection after being ventilated. If the time to ventilation is not modelled then the estimated effects of infection are prone to ‘length bias’, which tends to underestimate the effects of infection (although the effects on the relative risk of death are more difficult to predict) [Reference Wolkewitz14]. Once a patient has been ventilated they may either be discharged or die, or they may first become infected. If the time to infection is not modelled then this leads to time-dependent bias, which tends to overestimate the effects of infection [Reference Beyersmann, Wolkewitz and Schumacher9].
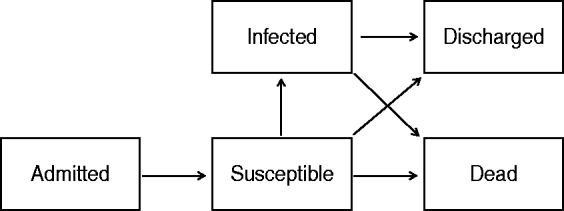
Fig. 1. Multi-state model used to estimate the time-dependent effect of nosocomial infection on length of stay and risk of death. Patients become susceptible to infection after they have been ventilated.
We censored patients when it was not known whether they died or were discharged, using a censoring date of their last day in ICU. We also censored patients who contracted another unrelated infection (e.g. an unrelated bloodstream infection) using the date of the unrelated infection. This censoring was used to ensure that we estimated the independent effect of VAP, and not the combined effects of multiple infections. This censoring meant we assumed partial transition probabilities for the multi-state model [Reference Andersen15].
We estimated the extra LoS and increased risk of death independently in each country. We then combined the results using a random-effects meta-analysis using a random intercept for each study. As a sensitivity analysis we re-ran the meta-analysis leaving out each country in turn. This assessed whether any particular country had a strong influence on the estimated mean effect. As another sensitivity analysis we first stratified admissions according to the Average Severity Illness Score (ASIS) score. We estimated the extra LoS and risk of death for admissions in the lower three ASIS categories (‘healthier’ group), and in the upper two categories (‘sicker’ group). ASIS was not collected in Greece or Lebanon, so these countries were excluded from this sensitivity analysis.
For all analyses R 2.11.0 software was used (R Foundation, Austria), using the ‘etm’ library to estimate the extra LoS due to infection [Reference Allignol16], and the ‘rmeta’ library for meta-analysis [Reference Lumley17].
RESULTS
Table 1 shows the summary statistics by country. Across all ten countries there were 283 069 ICU days observed after the patient had been ventilated. On average 11% of admissions with ventilation ended in death.
Table 1. Cohort characteristics by country
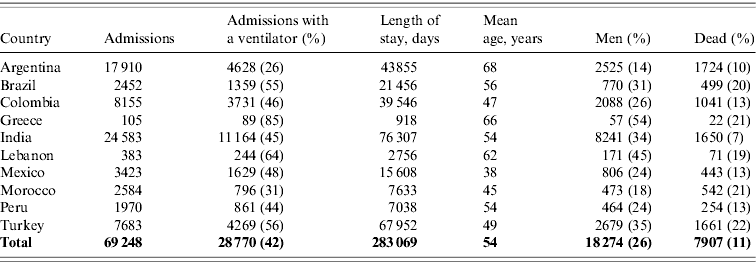
All statistics are for admissions with a mechanical ventilator, except the ‘Admissions’ column.
Table 2 shows the estimated extra LoS and risk of death due to infection by country and the meta-analysis summary. On average a VAP infection led to 2·03 extra days in the ICU [95% confidence interval (CI) 1·52–2·54 days] and a 14% increase in the risk of death (95% CI 2–27). For both estimates there was no evidence of heterogeneity between countries.
Table 2. Estimated extra length of stay (LoS) and relative risk of death due to a ventilator-acquired pneumonia
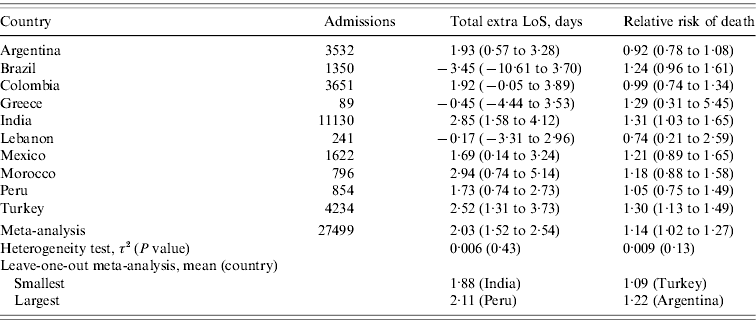
Values are means (95% confidence intervals).
Figure 2 plots the mean relative risk of death in each country and the meta-analysis. The most unusual result was from Lebanon, where an infection reduced the relative risk to 0·74, although this reduction was far from statistically significant (95% CI 0·21–2·59). Argentina also showed a non-significant reduction in the risk of death after infection. Without Argentina the mean relative risk of death rose slightly from 1·14 to 1·22 (14–22%).
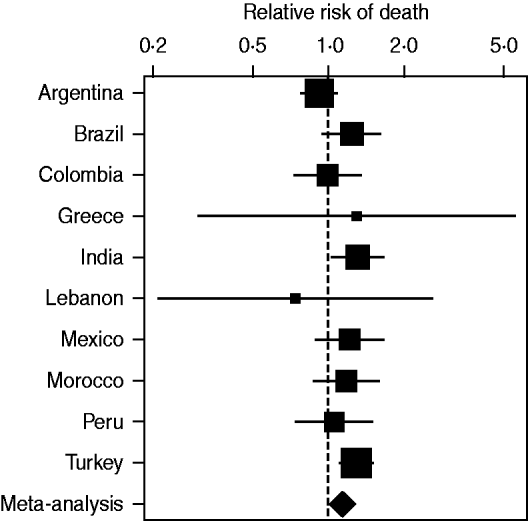
Fig. 2. Relative risk of death due to a nosocomial ventilator-associated pneumonia in each country and the overall relative risk from a meta-analysis. The relative risk axis is on a log scale. The squares are the mean estimates and the horizontal lines the 95% confidence intervals. The size of the squares is inversely proportional to the standard error of the estimate.
Figure 3 plots the mean extra LoS in each country and the meta-analysis. The extra LoS was shortest in Brazil (3·45 fewer days after infection), but this decrease was not statistically significant (95% CI −10·61 to 3·70).
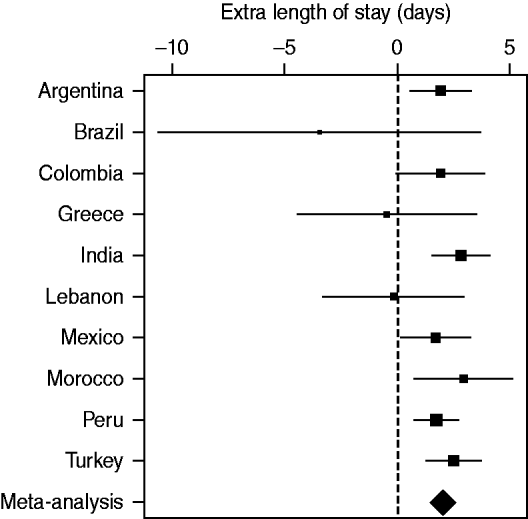
Fig. 3. Extra length of stay in days due to a nosocomial ventilator-associated pneumonia in each country and the overall extra length of stay from a meta-analysis. The squares are the mean estimates and the horizontal lines the 95% confidence intervals. The size of the squares is inversely proportional to the standard error of the estimate.
Table 3 shows the results after stratifying on ASIS. The mean relative risk of death was close to 1 and not statistically significant in either group. The estimated extra LoS were similar to the unstratified estimate for both ASIS groups.
Table 3. Estimated extra length of stay (LoS) and relative risk of death due to a ventilator-acquired pneumonia stratified by Average Severity Illness Score (ASIS)
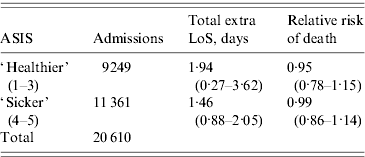
Values are means (95% confidence intervals).
The higher the ASIS score the sicker the patient.
DISCUSSION
We used the best available statistical methods to estimate the extra LoS and risk of death due to nosocomial VAP. These methods treat both the day of ventilation and the day of infection as time-dependent variables (Fig. 1). This means the results are not prone to length bias (which would underestimate the risks of infection), or time-dependent bias (which would overestimate the risks of infection).
The results were consistent between countries and showed a modest increase in the extra LoS due to infection as, on average, there were 2·03 extra days. This increase was strongly statistically significant, and this small increase still represents an important and potentially costly consequence of infection. Moreover, the increase remained after stratifying on ASIS score, so the extra LoS is independent of patient morbidity. A recent study in Europe found an excess LoS for pneumonia of 7·2 days for sensitive microorganisms and 6·3 days for resistant microorganisms [Reference Lambert18].
If an infection hastens the time to death then acquiring an infection appears to be a cost-saving event; this might be occurring in Brazil and Greece (Table 2). A good economic analysis will account for this by including changes to both costs and health benefits from a decision to adopt an intervention that reduces risk [Reference Graves5, Reference Graves, Halton and Lairson6]. The extra benefit from saving lives is likely to be valued far more than a few extra days bed day. Ideally bed days and lives are saved at the same time with extra infection control.
The relative risk for mortality was 1·14 on average, and again this increase was strongly statistically significant and reasonably consistent across countries. However, the risk disappeared after stratifying on ASIS score. This suggests that the original increased risk was due to confounding by ASIS. We know that sicker patients have an increased risk of death; the confounding would be complete if sicker patients were also more likely to get ventilator-associated infections.
The method we used to estimate the extra LoS and risk of death due to infection cannot adjust for important covariates such as age. However, a recent study by Beyersmann et al. demonstrated that adjusting for the timing of infection is likely to be more important than adjusting for confounders, as they found that adjusting for 20 potential confounders did not redeem the time-dependent bias [Reference Beyersmann19].
ACKNOWLEDGEMENTS
The authors thank the many healthcare professionals at each member hospital who assisted with the conduct of surveillance in their hospital, including the surveillance nurses, clinical microbiology laboratory personnel, and the physicians and nurses providing care for the patients during the study; without their cooperation and generous assistance this INICC would not have been possible. Mariano Vilar, Débora López Burgardt and Alejo Ponce de Leon (INICC headquarters, Buenos Aires), for their hard work and commitment to achieve INICC goals; the INICC country coordinators (Altaf Ahmed, Carlos A. Álvarez Moreno, Apisarnthanarak Anucha, Luis E. Cuéllar, Bijie Hu, Hakan Leblebicioglu, Eduardo A. Medeiros, Yatin Mehta, Lul Raka, Toshihiro Mitsuda, and Virgilio Bonilla Sanchez); the INICC Advisory Board (Carla J. Alvarado, Gary L. French, Nicholas Graves, William R. Jarvis, Patricia Lynch, Dennis Maki, Russell N. Olmsted, Didier Pittet, Wing Hong Seto and William Rutala), who have so generously supported this unique international infection control network; and Patricia Lynch, who inspired and supported us to follow our dreams despite obstacles.
APPENDIX
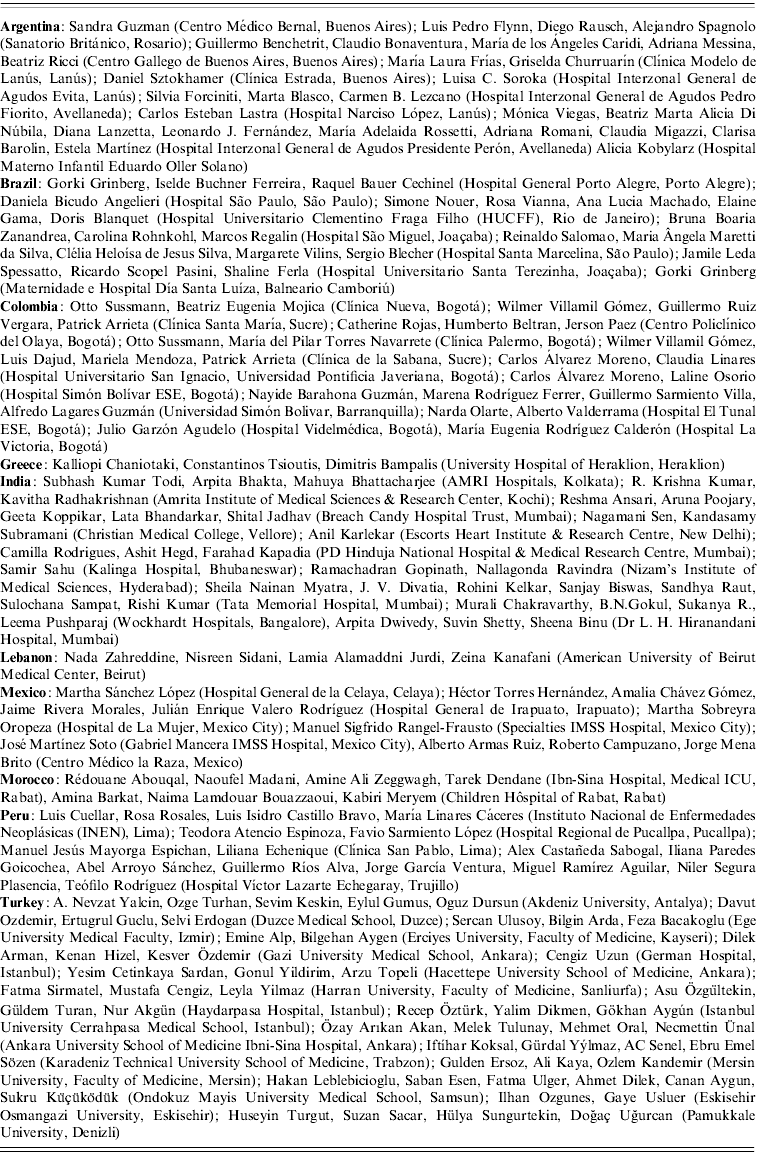
International Nosocomial Infection Control Consortium (countries listed alphabetically)
DECLARATION OF INTEREST
None.


