1 INTRODUCTION
Studying the stellar evolution in terms of chromospheric activities and kinematics of stars themselves within the Galaxy could also impact on what we know about planetary nebulae (PNe) i.e. when the star’s interiors are completely revealed with enriched matter content which will be fed to interstellar medium (ISM) with stellar wind, and therefore enriching the ISM. The key point in these studies lie in the spectroscopic observations of PNe when accurate emission line fluxes are measured (Madsen et al. Reference Madsen, Frew, Parker, Reynolds, Haffner, Barlow and Méndez2006). Moreover, with the help of this knowledge we can understand how these regions are related to the general structure of the ISM.
In the past, there were several works that they have relied on standard star observations using broad band photometry or spectrophotometry, or even using photon counting detectors. However, these observations help little in improving the emission line flux standards of PNe, H ii regions, cataclysmic variables, supernova remnants, etc. (Wright, Corradi, & Perinotto 2005). For photon counting coupled with interference filters: Liller (Reference Liller1955) and O’Dell (Reference O’Dell1963) had several large error sources such as unknown central wavelength of transmission curves, temperature variations, filter age, and misalignment of various optical components. For broad band photometry (Johnson & Harris Reference Johnson and Harris1954; Landolt Reference Landolt1992) and spectrophotometry: (Stone & Baldwin Reference Stone and Baldwin1983; Massey et al. Reference Massey, Strobel, Barnes and Anderson1988; Oke Reference Oke1990); even though there are many types of standard stars available, the flux standards of emission lines are still not adequate in number. In addition to this, several emission and absorption lines coincide in continuum standards (e.g. Balmer series) and when narrow band filters are used, exact contribution of the line fluxes would be difficult. Contrary to abovementioned observation methods, using low read-out noise and high quantum efficiency Charge Coupled Devices (CCDs), spectrophotometry of emission lines of PNe’s could very accurately be measured even for faint sources.
Therefore, high precision photometric studies of the emission line fluxes of ionised nebulae are needed.
Lately, Dopita & Hua Reference Dopita and Hua1997 (hereafter D97) made slitless spectrophotometric observation of southern compact PNe chosen from the catalogue of Acker et al. Reference Acker, Marcout, Ochsenbein, Stenholm, Tylenda and Schohn1992 (hereafter A92). They gave Hα, Hβ, O iii and laboratory wavelengths of N ii and S ii emission lines for 39 PNe. For northern hemisphere sources, Wright et al. Reference Wright, Corradi and Perinotto2005 (hereafter W05) presented all emission lines of only 6 PNe using similar techniques. Although this was off to a good start, it is not sufficient for northern hemisphere.
By increasing the northern hemisphere sources to 17 with this work, a complete set of emission line standards will be builded up for both hemisphere.
2 OBSERVATIONS
The catalogue of A92 includes 1 142 PNe. Therefore, it is used as the main source of our work. The PNe to be observed were selected according to the following criteria:
• To select only northern hemisphere PNe, first declination is limited to δ > −35° which reduces the total number to 838.
• Then, RA in between 7h and 12h are excluded from the selection which reduces the total number to 805 PNe.
• From this subset, angular size of PNe smaller than 5 arcsec are selected (i.e. PNe fits to the available slit size). This reduced the total number to 276 PNe.
• Then, less studied 12 PNe were selected.
• 5 PNe which were studied by W05 were added to this subset increasing the total number to 17.
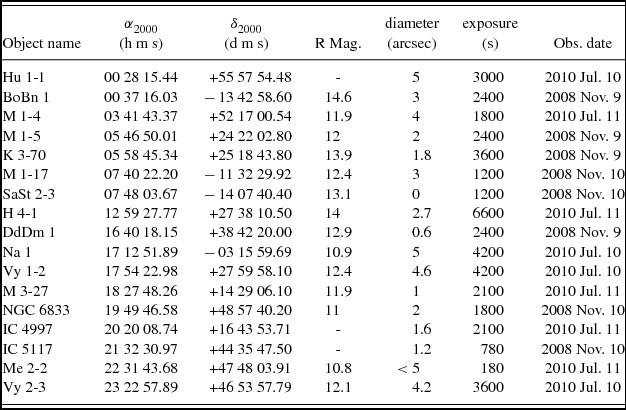
Journal of observations for the selected PNe are given in Table 1.
Table 1. Journal of observations for the target list. Description of the columns are as follow. The most common object names (Column 1), source coordinates (Column 2 and 3), R magnitude of the source given in SIMBAD (Column 4), source diameter in arcsec (Column 5) given in A92 catalogue, total exposure for blue and red grism (Column 6) and observation date (Column 7).

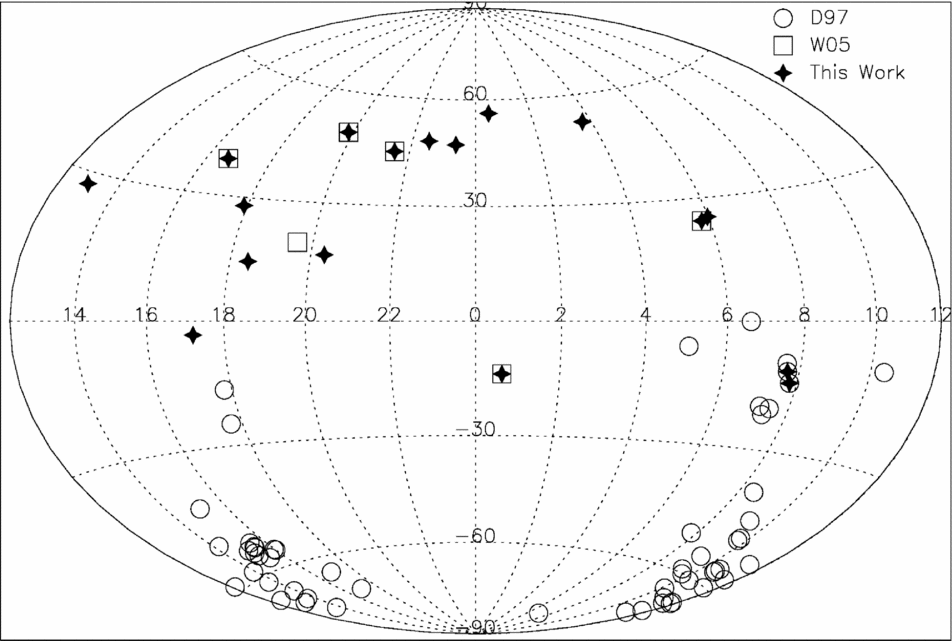
Sky distribution of target list given in Table 1 is shown in Figure 1. It contains sources of both D97 and W05. It can easily be seen from the figure that our aim of filling sky coverage gaps in northern hemisphere is achieved.

Figure 1. The sky distribution of our target list (stars) in equatorial coordinates. The source of W05 and D97 are represented by squares and circles, respectively.
The observations were performed with the TFOSCFootnote 1 (TÜBİTAK Faint Object Spectrometer and Camera) coupled with the 150 cm Russian–Turkish Telescope (RTT150). The camera is equipped with a 2048x2048 (15 μm) pixel Fairchild 447BI CCD.
The mean seeing level throughout the observing nights were 1.9 arcsec, ranging from 0.6 to 2.6 arcsec. The seeing measurements were calculated from unfiltered frames by averaging over Full Width at Half Maximum's (FWHM) of field stars which were taken just before the spectrum observations. The seeing characteristics of the site were well determined by Ozisik & Ak (Reference Ozisik and Ak2004).
In the spectroscopic work, mainly G7 (Grism 7: 3 850–6 850 Å; visible), G8 (Grism 8: 5 800–8 300 Å; red) and G14 (Grism 14: 3 275–6 100 Å; blue) were used. The average dispersions were 1.5, 1.1, and 1.4 Å/pixel for G7, G8, and G14, respectively. Considering the telescope optics and seeing conditions, an optimum signal-to-noise ratio (SNR) was reached with the following exposure times: 60 s for Me 2-2 (a typical bright PNe) and 3600 s for H 4-1 (a typical faint PNe). Note that the exposure times were determined according to source’s R magnitude given in Table 1.
Each PNe was observed with a slit size which was varied according to the PNe’s angular size and seeing: 3.5 arcsec for point-like sources and 7.3 arcsec for wider sources. The slit position and therefore dispersion axis is aligned to the parallactic angle to avoid loss of light due to the atmospheric refraction. Contrary to work of D97 in southern hemisphere, PNe coordinates in northern hemisphere were quite accurate: Source-to-source pointing accuracy was kept < 5 arcsec and there were no loss of frames due to the autoguider failures.
3 DATA ANALYSIS
Headers of TFOSC images were processed using IDLFootnote 2 and then they were reduced using standard IRAFFootnote 3 tasks e.g. onedspec and image. The instrumental profile of the sensor was subtracted using standard reduction packages of Image Reduction and Analysis Facility (IRAF). The images were then converted into 1D spectra by using the apall task. As for the last stage wavelength and flux calibrations tasks were applied to the spectra.
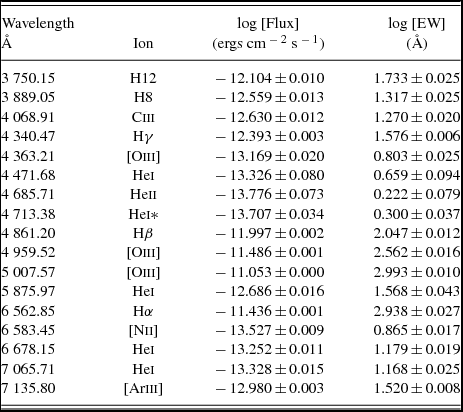
To achieve a sensible accuracy in the wavelength calibration, different arc lamps were used for different grisms: He+Ne for Grism 7 (hereafter G7); Ne for Grisim 8 (hereafter G8); He for Grism 14 (hereafter G14). Arc lamp atlas of ALFOSC (another spectrograph in FOSC series)Footnote 4 were used to identify the lines in the spectra. The resultant accuracy of wavelength calibration was around ±1 Å. The reference wavelength used in flux measurements are given in Tables 5–21.
Fluxes of spectrophotometric standards listed in Stone & Baldwin (Reference Stone and Baldwin1983), Baldwin & Stone (Reference Baldwin and Stone1984), Massey et al. (Reference Massey, Strobel, Barnes and Anderson1988), and Oke (Reference Oke1990) were used in flux calibration of all PNe. The standard stars have to be identified both in one of the abovementioned catalogues and in IRAF’s repository of standard stars; then the closest one to the target PNe was chosen to eliminate the effect of airmass. Finally, flux calibration tasks of IRAF (standards, sensitivity, and calibrate) applied to PNe images.
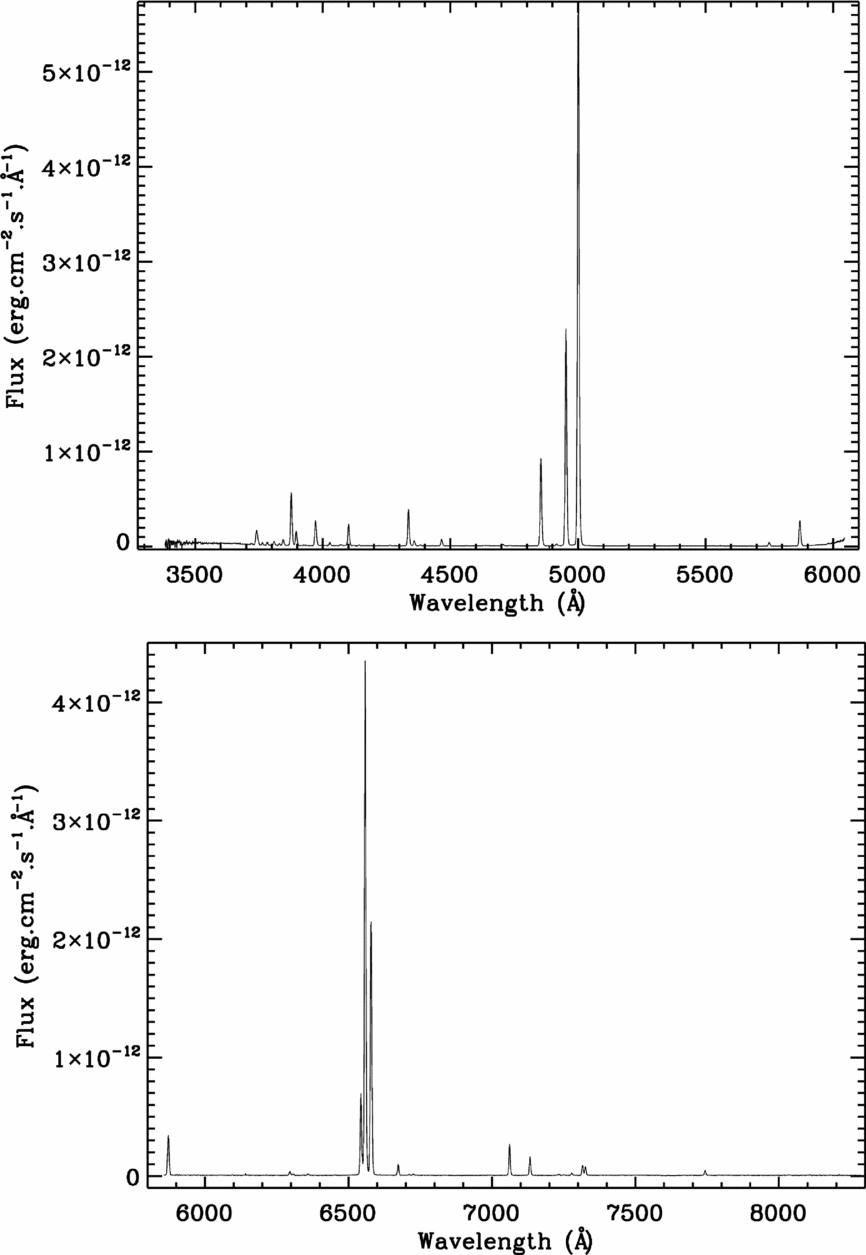
A typical reduced pair (red and blue) of spectra are shown in Figure 2. The bright lines in red spectrum are N ii λ6 548.05, Hα λ6 582.85, and N ii λ6 583.45, and in blue spectrum Hβ λ4 861.29, O iii λ5 007.57 and O iii λ4 959.52.

Figure 2. The blue (above panel) and red (below panel) spectra of Me 2-2.
4 RESULTS AND DISCUSSIONS
The dataset of each PNe is produced by measuring the line flux and their equivalent widths of selected emission lines. In measuring these values, background of each emission line has to be determined and then removed by a first order polynomial fit to the line extending to its wings. The background level of each emission line on the continuum was determined around the line.
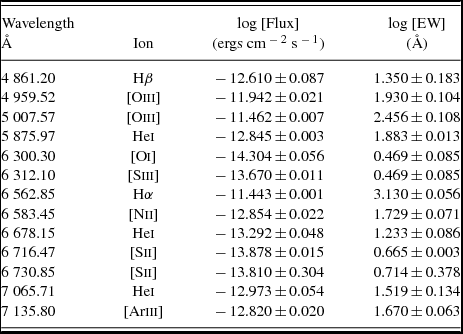
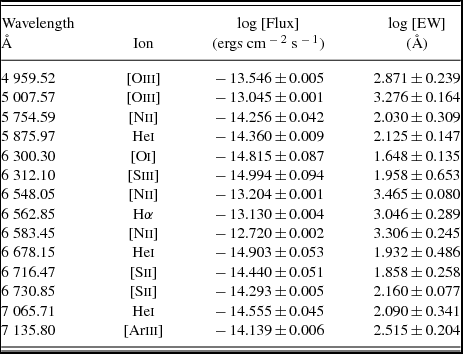
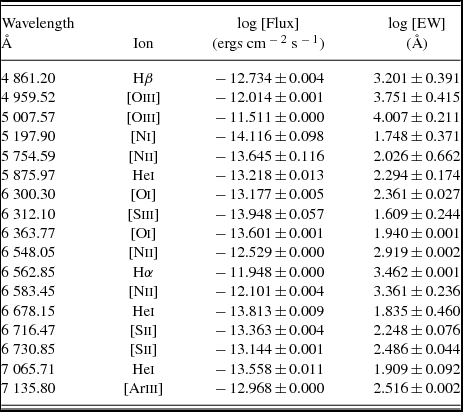
The flux values and equivalent widths were then calculated by best fitting to the line. The values and their errors are given in Tables 5–21 which were computed by averaging multiple measurements of Gaussian fits of the same line. The standard deviation of the fits are then taken as the error values. All the measurements were done using standard tasks of IRAF.
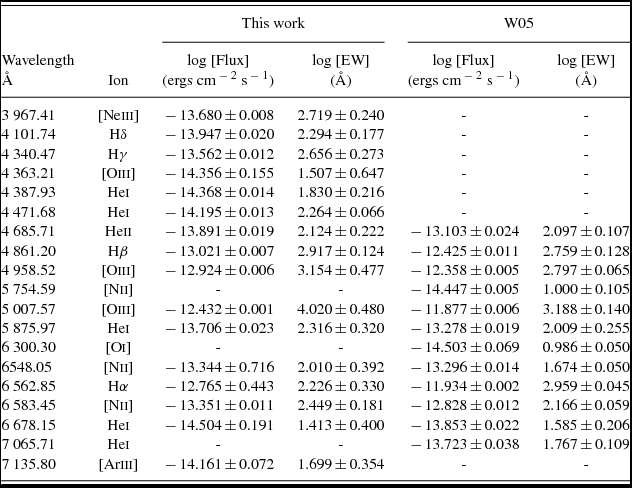
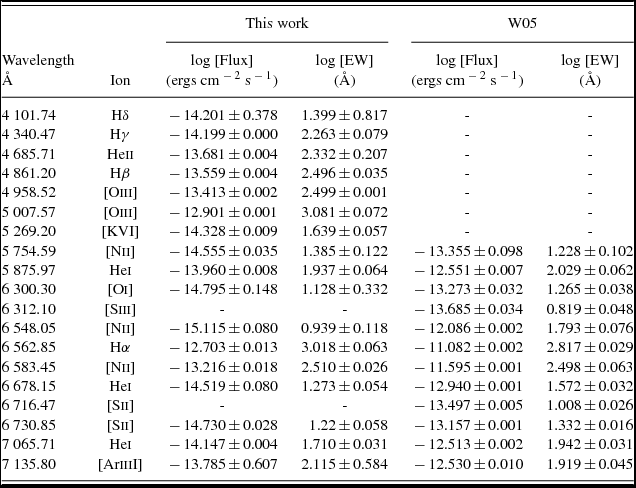
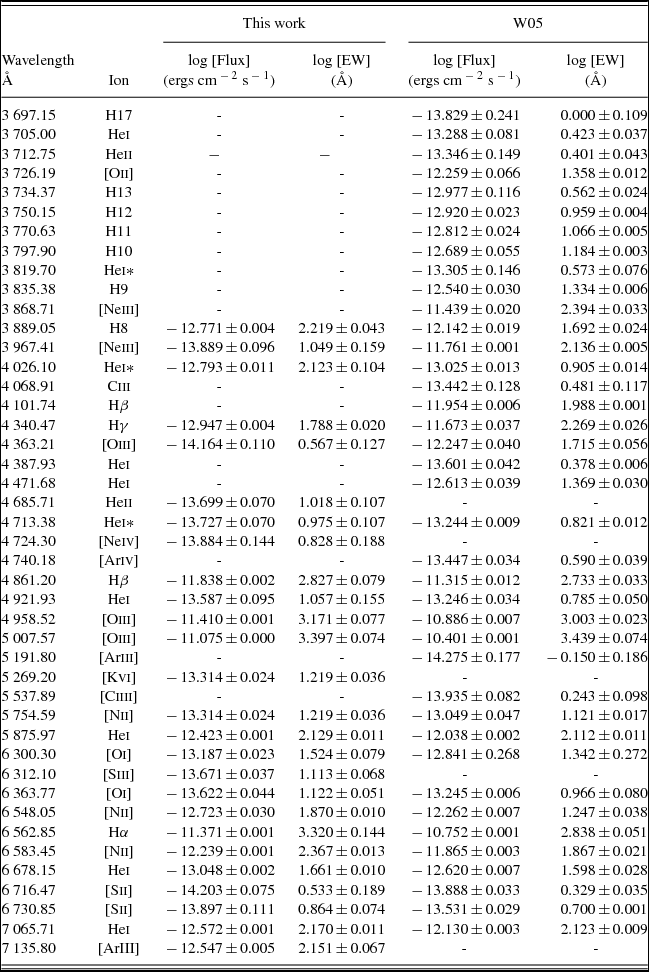
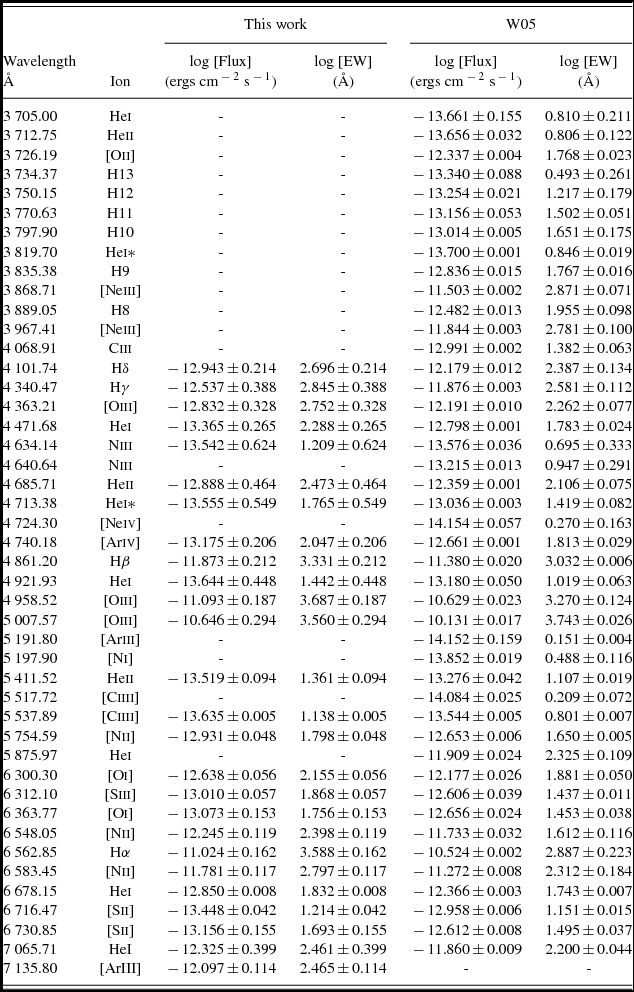
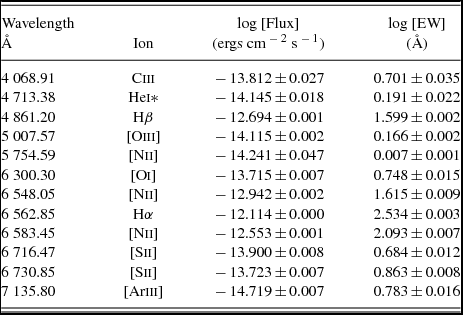
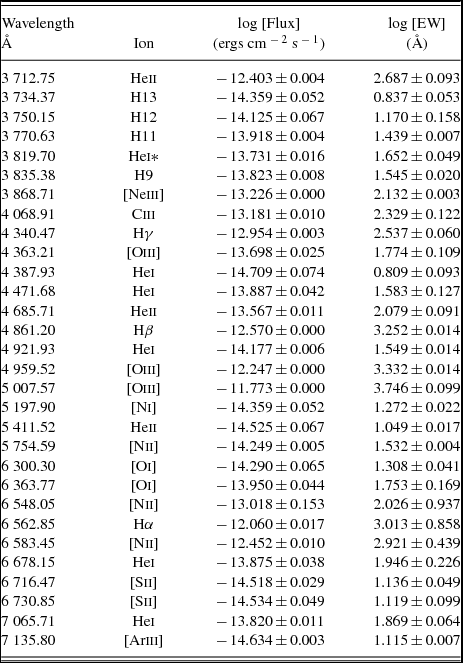
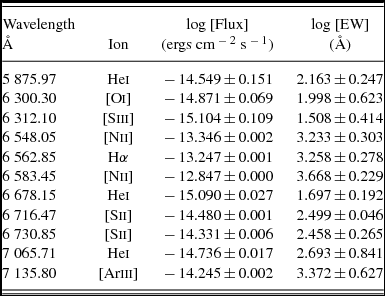
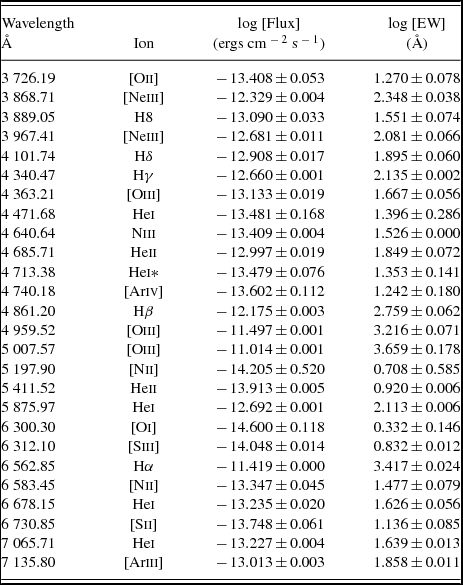
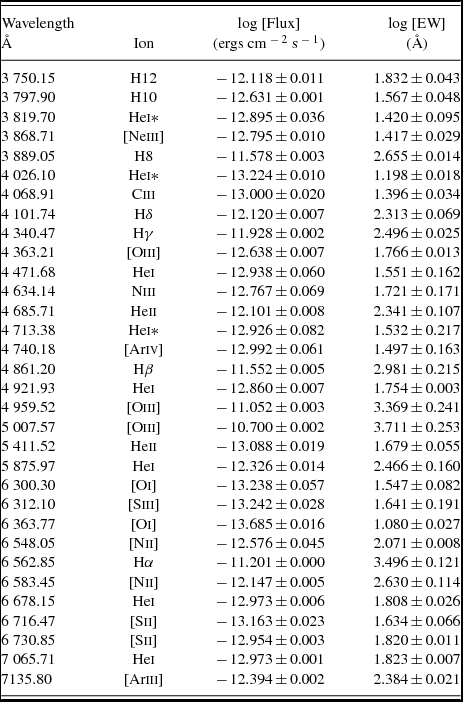
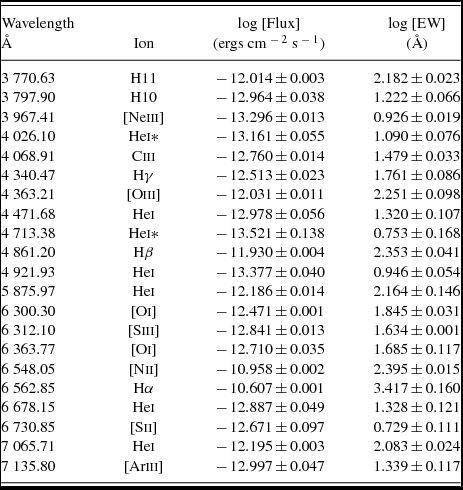
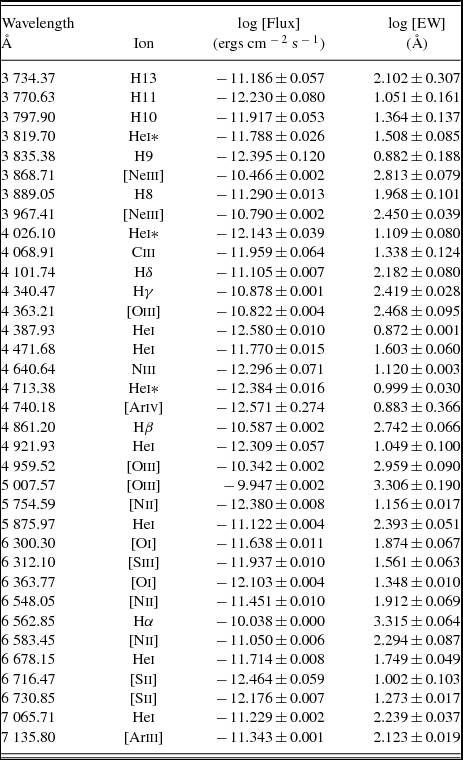
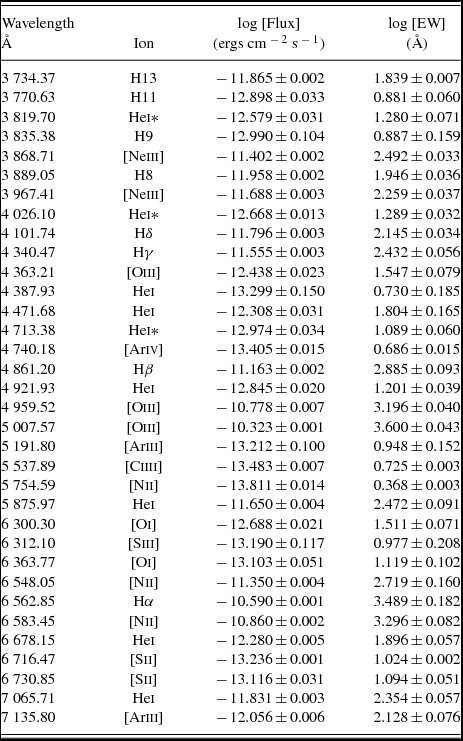
Our values and values of W05 data for PNe: BoBn 1, M 1-5, NGC 6833, and IC 5117 are given in Tables 5–8, respectively. Missing values in the tables are due to the grisms having different wavelength coverages. For PNe DdDm 1, however, due to having no overlapping wavelength coverage it is excluded in Table 15. Note that, He i lines are double blended in all data sets.
The corresponding error values of the data given in Tables 5–21 are around ±0.03 dex with a standard deviation of ±0.003 dex. To get an impression of the error budget, percentages of flux-to-error ratios are summed over both for all the emission lines and for five bright emission lines, and they are listed in Table 2.
Table 2. The error budget of the measurements of all 17 PNe: for all emission lines (first column) and five bright lines of Hα, Hβ, O III, N II and He I (second column).

Number of lines detected for each object varied between 11 and 35 amounting to 375 emission lines for all objects. In addition to this in total 49 different emission lines were identified where they were mostly caused by collisions (Kwok Reference Kwok2000, p. 260) or they were the recombination lines of H i, He i and He ii. However, a considerable amount of recombination lines of heavy elements were also detected such as O i, O ii, O iii, C iv, and Ne iii. In some of the sources (BoBn 1, K 3-70, DdDm 1, and M 1-4) emission lines were observed on an elevated continuum level which was due to the recombination of electrons.
Among 49 emission lines, the brightest (unsaturated) and faintest ones were the O iii λ5 007.57 with − 9.947 ± 0.002 from IC 4997, and N II λ6 548.05 with − 15.115 ± 0.080 from M 1–5, respectively. Emission line fluxes of PNe are directly proportional with optical R magnitude of the source (see Table 1) which was also noted in this work (see Tables 5–21).
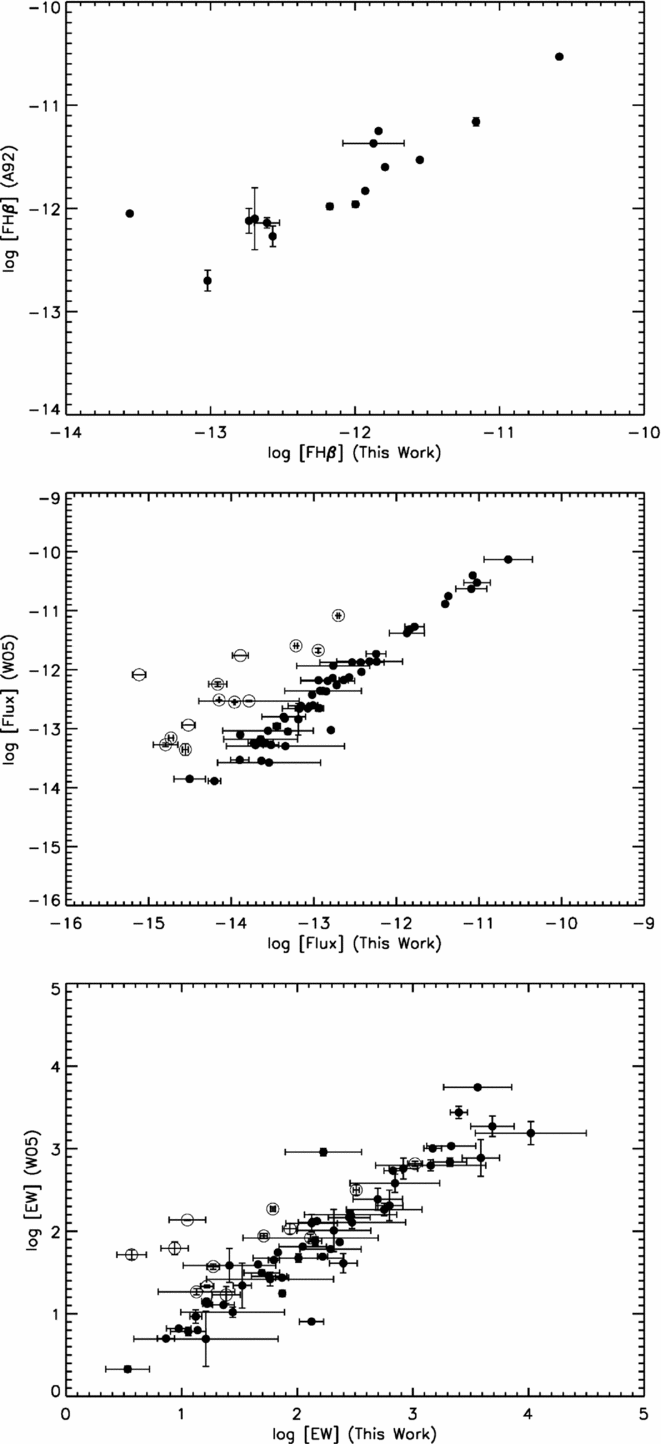
Observed Hβ fluxes were compared with A92 and plotted in top panel of Figure 3 (17 in total). As can be deduced from the plot, an obvious linear relation exists for both bright and faint flux arms with a R2 value 0.89 on the faint arm.

Figure 3. In the top panel a comparison of Hβ fluxes of A92 (vertical) with this work (horizontal) is given. In the middle and bottom panels, a comparison of all emission line fluxes (in total 64 for 4 PNe) and EW of W05 (vertical) with this work (horizontal) are given, respectively. Open circles represent faint and blended He i lines. All axes are in log scale and fluxes are in ergs cm 2s −1.
A similar comparison was done for W05 including all emission lines (64 in total). However, only 4 PNe (BoBn 1, IC 5117, M 1-5, and NGC 6833) were used in the comparison (see Tables 5–8). The comparisons for flux and EW values are shown in middle and bottom panels of Figure 3, respectively. Corresponding R2 values of flux and EW are 0.96 and 0.88, respectively. The deviations seen in the regression are mainly due to not resolving the faint lines.
In comparing our values with W05, there are some discrepancies which have to be mentioned in detail. The error in flux measurement of each emission line (Table 2) amounts to less than 1% of the line strength. On top of this, low SNR of the spectra on relatively bad seeing conditions produced slit losses which accumulated to no more than 10% of the signal, therefore causing a relatively low flux value. However, in the absence of these negative effects a high consistency is achieved in the comparison which makes the results on the whole reliable.
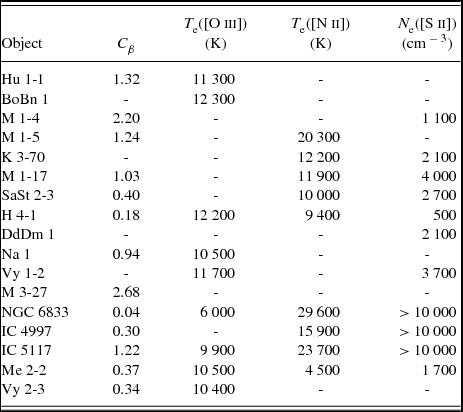
Physical and chemical properties for all PNe having suitable data sets were also calculated. The analysis of the data was based on Corradi et al. (Reference Corradi, Perinotto, Schwarz and Claeskens1997). Since the Balmer decrement is a sign of extinction along the observed column of ISM, extinction constant (c β) were calculated using H α/H β ratio. Electron temperatures (T e) and densities (N e) were calculated using IRAF’s nebular.temden task. Electron temperatures of T e([O iii]) and T e([N ii]) were calculated according to Osterbrock & Ferland (Reference Osterbrock and Ferland2006). Using ratio of [S ii]λ6716/λ6731 and assuming an electron temperature of T = 104 K, electron densities were calculated. All above calculations are given in Table 3.
Table 3. Logarithmic extinction constant c β, and electron temperatures and densities.

For each PNe, the ionic abundances relative to Hydrogen are computed from the line fluxes relative to Hβ using the temperatures and densities values given in Table 3 (see e.g. Kingsburgh & Barlow Reference Kingsburgh and Barlow1994; Wesson, Liu, & Barlow Reference Wesson, Liu and Barlow2005 for computation methods). These abundances are given in Table 4.
Table 4. Ionic abundances relative to Hydrogen. All values are scaled with 10−6.

Table 5. BoBn 1 fluxes and equivalent widths.

Table 6. M 1-5 fluxes and equivalent widths.

Table 7. NGC 6833 fluxes and equivalent widths.

Table 8. IC 5117 fluxes and equivalent widths.

Table 9. Hu 1-1 fluxes and equivalent widths.

Table 10. M 1-4 fluxes and equivalent widths.

Table 11. K 3-70 fluxes and equivalent widths.

Table 12. M 1-17 fluxes and equivalent widths.

Table 13. SaSt 2-3 fluxes and equivalent widths.

Table 14. H 4-1 fluxes and equivalent widths.

Table 15. DdDm 1 fluxes and equivalent widths.

Table 16. Na 1 fluxes and equivalent widths.

Table 17. Vy 1-2 fluxes and equivalent widths.

Table 18. M 3-27 fluxes and equivalent widths.

Table 19. IC 4997 fluxes and equivalent widths.

Table 20. Me 2-2 fluxes and equivalent widths.

Table 21. Vy 2-3 fluxes and equivalent widths.

In calculating the values of Table 4, de-reddened fluxes have been used according to Acker (Reference Acker, Rozelot and Neiner2011). In addition to this, excitation class of each PNe was also calculated according to Gurzadian & Egikian (Reference Gurzadian and Egikian1991) in which the nebular lines have been used as a (loosely) measure of the temperature of the central white dwarf. Note that, if the stellar nuclei of the PNe is found to be very hot then it can be taken as a high excitation PNe. Therefore, Hu 1-1, BoBn 1, and Vy 1-2 fall into this category. However, if some related lines are missing from the central region then a definitive calculation could not be made. Therefore the following PNe fall into this unidentified category: M 1-4, K 3-70, M1-17 SaSt 2-3, DdDm 1 M 3-27, IC 4997, and Me 2-2. Finally, the rest of the PNe can safely be classified as medium excitation PNe.
These studies can significantly contribute to the study of the evolution of the PNe and the Galaxy.
5 CONCLUSIONS
• A similar study of D97 (for southern Hemisphere) and W05 (for northern Hemisphere) have been carried out by extending the northern hemisphere coverage of PNe.
• We present new emission line fluxes to be used as a standard in both imaging in narrow band and in Fabry–Perot spectroscopy.
• Emission line flux measurements of 12 PNe were made for the first time.
• Physical and chemical properties of PNe, as well as their evolution, can be studied with continuous monitoring of these 17 PNe.
• For suitable PNe, extinction constant, electron temperature, electron density, chemical abundance, and excitation class have been calculated.
ACKNOWLEDGEMENTS
The authors thank to the scientific and technological research council of Turkey (TUBITAK) for a partial support in using RTT150 (Russian–Turkish 1.5-m telescope) in Antalya through with project numbers 10BRTT150-33-0 and 10ARTT150-489-0. NA also thank to TUBITAK National Observatory (TUG) staff. NA gratefully acknowledges support through a Post-Doc Fellowship from the TUBITAK-BIDEB at Physics Department of Middle East Technical University, Ankara–Turkey. The author also grateful to M. E. Ozel for reading and correcting the manuscript and for his valuable remarks.


