


The 24 h dietary recall is a frequently chosen method of dietary assessment. It does not require literacy skills and is therefore often used in settings where study subjects would not be able to self-record their food consumption. However, like other dietary assessment methods it is not free from error. The most important challenges in the 24 h recall include difficulties to recall the food items and their amounts, and inability to accurately estimate portion sizes(Reference McPherson, Hoelscher and Alexander1). The success of the method is also dependent on the skills and persistence of the interviewer and the motivation of the subject(Reference McPherson, Hoelscher and Alexander1, Reference Acheson, Campbell and Edholm2). Different types of aids for estimating the portion size, such as household utensils, food replicas or other three-dimensional models, drawings and food photographs, are often used(Reference Løken3, Reference Henderson Sabry and Campbell Asselbergs4).
Food photographs have long been used as aids in portion size estimation throughout the world. A photographic booklet is convenient compared with three-dimensional models for example, since it is easy for the interviewer to carry and can include a wide range of different types of foods. In high-income countries, the validity of using food photographs in portion size estimation has been studied in different age groups, including adults(Reference Faggiano, Vineis and Cravanzola5–Reference Ovaskainen, Paturi and Reinivuo9), adults and elderly persons(Reference Nelson, Atkinson and Darbyshire10) and children and adolescents(Reference Frobisher and Maxwell7, Reference Lillegaard, Overby and Andersen11, Reference Foster, Matthews and Lloyd12). The study designs have varied from studies in which the subjects serve themselves a variety of foods in portions of their choice and the next day they are asked to recall the food items and estimate their amounts(Reference Faggiano, Vineis and Cravanzola5) to studies in which the food is not eaten but shown to the subject and the assessment of portion size is done simultaneously(Reference Ovaskainen, Paturi and Reinivuo9). In general, despite the fact that there is large variation in individuals’ ability to estimate portion sizes(Reference Frobisher and Maxwell7–Reference Foster, Matthews and Lloyd12), many studies have shown acceptable results on the group level(Reference Lucas, Niravong and Villeminot6, Reference Turconi, Guarcello and Berzolari8–Reference Foster, Matthews and Lloyd12) and the use of food photographs has become an established practice in dietary studies. More recently, portion size photographs have also been developed to be used on computer screen(Reference Foster, Matthews and Lloyd12–Reference Probst, Jones and Sampson14).
In Africa, the validity of using food photographs in portion size estimation has previously been tested in South Africa(Reference Venter, MacIntyre and Vorster15) and Burkina Faso(Reference Huybregts, Roberfroid and Lachat16). Since food habits vary between (and within) countries, it is important that the food photographs used in a dietary study represent the most important local food items and dishes of the area. In preparation for the larger ZANE study (Estudo do Estado Nutricional e da Dieta em Raparigas Adolescentes na Zambézia), which aimed to produce information on the diet and nutritional status of adolescent girls in Zambezia Province in Mozambique, the present study assessed the validity of using food photographs in portion size estimation among adolescent Mozambican girls.
Methods
Setting
The study was carried out in Zambezia Province in September 2009. Zambezia Province is located in central Mozambique and its capital is the coastal town of Quelimane. The study was conducted in three different locations: two neighbourhoods in the outskirts of Quelimane and the small town of Nicoadala next to Quelimane.
Food photographs
Before the study, two preliminary field trips to Zambezia Province were made to collect information on the food selection and the types of most commonly eaten dishes. Several household visits were made to observe cooking and to gain an understanding of the portion sizes consumed. Twenty of the visits were made specifically to households where there was an adolescent girl and those visits were scheduled to lunch or dinner time so that the food portion of the girl could be weighed before she started her meal.
The food photographs were produced in Zambezia immediately before the study. Commonly consumed staple foods and sauces (or stews) which were considered feasible to cook in the test setting were chosen to be presented in the photographs. The choice of the foods was also discussed with a group of local women who cooked the test meals. The foods chosen to be photographed and tested were: (i) rice; (ii) thick maize porridge (chima); (iii) shrimp sauce made from dried shrimps with coconut milk and onion; (iv) cowpea sauce cooked with tomato and onion; and (v) fish sauce made from small dried fish with tomato and onion.
Three different portion sizes (‘small’, ‘medium’ and ‘large’) of each food were placed on plates (Table 1). The portion sizes were decided by the first author based on the observations during household visits and discussions about typical portion sizes with the local women who prepared the foods. Thick maize porridge is always served in the form of balls, but the size of the ball may vary depending on the cook. Typically one adolescent girl eats one or two balls per meal. A single ball was depicted in each of the three maize porridge photographs. Locally, a variety of different enamel, metal, china, glass and plastic dishware is used. For the photographs, plates that were not patterned and did not reflect light were selected. Two different plastic plates were used: a white, flat plate for the staple foods and an orange, deeper plate for the sauces.
Table 1 Portion sizes depicted on the food photographs
The portions were photographed outdoors immediately after cooking. The plates were set on a table covered with beige fabric. The photographs were taken with a digital camera using a tripod and the camera angle was set on about 45°. Before printing, the photographs were adjusted in GIMP (Gnu Image Manipulation Program) to appear approximately life-size in print. The photographs were printed on photographic paper in size A4 with a portable inkjet colour printer.
Participants
The participants, 13–18-year-old girls, were volunteers recruited from houses around the study locations by local assistants. Recruitment was continued until the target number of 100 girls had agreed to participate in the study. The data for weight of leftovers was missing for one girl. Thus, the final number of participants included in the analysis was ninety-nine.
Study protocol
The study was conducted according to the guidelines laid down in the Declaration of Helsinki and all procedures involving human subjects were approved by the University of Helsinki Viikki Campus Research Ethics Committee. Written informed consent was obtained from all participants. Study activities were organized during 6 d at home yards of local families who kindly allowed the study team to cook, serve the meals and conduct interviews. Ten to twenty-one girls participated per day. The study activities were organized both in the morning and afternoon to ensure that all those who were willing to participate could come either before or after their school classes. The participants were told that they would be offered food and some questions would be asked but they were not told they would be asked to estimate the size of their portion. The participants were not offered any other incentive than the test meal. A short questionnaire including questions about their age, marital status, schooling, household characteristics, language, number of children and pregnancy at the time of the study was filled in by a Mozambican member of the study team. If the participant had any type of identification document, the date of birth was checked from it. Otherwise, the year of birth was estimated based on the girl's and her family members’ reports.
Each participant was served a meal consisting of two of the foods depicted in the food photographs: either rice or thick maize porridge and one of the different sauces. The recipes of the foods were the same as those used in the photographs. Five different portion sizes of rice, shrimp sauce, cowpea sauce and fish sauce were served and the portions were either identical to the portions in the photographs or between the photographs. Maize porridge was served in seven different portion sizes: three that were identical to the food photographs, two that were between the weights of the balls in the photographs, one that included two ‘small’ balls and one that included two ‘medium’ balls. A list including different combinations of the staple foods and sauces was prepared. Small to medium portions of staple foods were combined together with small to medium portions of sauces and medium to large portions of staple foods were combined with medium to large portions of sauces. The list was then arranged in a random order using the Excel RAND function. The different portions were weighed and allocated to each incoming participant following this pre-established list of portion sizes.
The staple food and the sauce were served on separate plates. The plates used were identical to the plates on the photographs. Possible leftovers were weighed and recorded and the weight was subtracted to calculate the actual portion size consumed. Weighing was done with a Maul electronic solar scale with an accuracy of 2 g. Water was available for drinking with the meal. The girls ate their meal as a group and immediately after the meal (within approximately the next half hour) each girl was individually interviewed by the first author with the help of a local interpreter. The girl was asked to estimate the amount she had eaten with the aid of the food photographs. Empty plates and a spoon, identical to those used during the meal, were also available during the interview.
The participants were allowed to describe their portion freely, by indicating the correct photograph or for example showing from the photograph which part of the portion they consumed, in which case the interviewer estimated a percentage of the portion in the photograph. The participants were also asked if there were leftovers and asked to describe the amount with the help of the photographs or for example as spoonfuls. The interviewer was aware of the possible range of the served portions but neither she nor the interpreter was aware of which portion sizes from the random list were served to each participant.
Data analysis
Statistical analyses were made with the statistical software package PASW Statistics 17·0 Release 17·0·2. Means and standard deviations of the actual and estimated portion sizes were calculated for each test food. The differences between the estimated and actual portion sizes were calculated, first as the difference in grams (estimated – actual) and second as the difference relative to the actual portion size ((estimated − actual)/actual × 100; referred to here as ‘percentage difference’), and means and 95 % confidence intervals were calculated for both. The observation pairs of all portions were also grouped together to calculate the mean percentage difference for all foods combined.
Spearman's rank correlation coefficients were used to assess correlation between the actual and estimated portion sizes. The data for actual and estimated portion sizes of each food were divided into thirds of the distribution and the numbers and percentages of participants in the same and opposite thirds calculated. The numbers and percentages of participants whose estimate was within ±10 %, below −10 % or above +10 % of the actual portion size, were also calculated.
Pearson's χ 2 test was used to assess differences in the proportions of participants whose estimates were within ±10 % of the actual portion size or not by age group (13–15 years v. 16–18 years), the number of years attended at school (1–7 years v. 8–10 years) and school attendance at the time of the study. For the χ 2 tests, the data were combined into two sets, one for staple foods and one for sauces.
Bland–Altman plots with 95 % limits of agreement were made for each test food to visually inspect the agreement between the actual and estimated portion sizes. In order to display the large number of overlapping observations, the PASW jitter.normal function was used to add random variation in the data when drawing the Bland–Altman plots.
Results
The background characteristics of the participants are presented in Table 2. The majority of the participants reported attending school at the time of the study. Despite their young age, 36 % of the participants either already had children or reported being pregnant at the time of the study. Chuabo and Portuguese were the most commonly spoken languages.
Table 2 Self-reported characteristics of the study participants: adolescent girls aged 13–18 years (n 99), Zambezia Province, Mozambique, September 2009
*Information on the number of children missing for one participant who reported having children.
†Information missing for one participant.
The largest mean percentage difference between the estimated and actual portions was found for rice, which was underestimated by 19 % on average (Table 3). The mean percentage differences for cowpea sauce and fish sauce were very small. When all 198 observation pairs for different foods were combined, the mean percentage difference was −5 % (95 % CI −12, 2 %).
Table 3 Mean actual and estimated portion sizes, mean difference in grams, mean percentage difference and Spearman's rank correlation coefficients: adolescent girls aged 13–18 years (n 99), Zambezia Province, Mozambique, September 2009
*Estimated – actual.
†(Estimated – actual)/actual × 100.
‡All values for r s are significant at P < 0·01 (two-tailed).
The Spearman's rank correlation coefficients ranged from 0·46 for shrimp sauce to 0·73 for rice and all of the coefficients were statistically significant (Table 3). For most foods, 60 % or more of the participants were classified into the same thirds of the distribution by estimated and actual portion sizes (Table 4). The shrimp sauce was an exception with only 38 % of the participants classified into the same third. The proportion of participants with estimates within ±10 % of the actual portion size ranged from 20 % to 38 % for different foods (Table 4). Overall, the estimates of the staple foods tended to be underestimated and the estimates of different sauces were somewhat more equally spread towards both under- and overestimation.
Table 4 Proportion of participants classified in the same or opposite thirds of the distribution of estimated and actual food consumption and proportion of participants whose estimates were within ±10 % of actual portion size: adolescent girls aged 13–18 years (n 99), Zambezia Province, Mozambique, September 2009
*Estimated/actual × 100 = 90–110.
There were no significant differences in the proportions of participants between the estimate categories (within ±10 % the actual portion size or not) for staple foods or sauces with regard to age or school attendance at the time of the study. The P value for association between the estimate categories for staple foods and years in school was close to significant (P = 0·05, two-sided) with 49 % of estimates within ±10 % of the actual portion size for participants who reported having attended school for 8–10 years compared with 29 % for those with less schooling. However, there was no such association for sauces.
The Bland–Altman plots (Fig. 1a–e) showed that small portions were often correctly estimated and that in the case of staple foods, especially larger portions tended to be biased towards underestimation. The 95 % limits of agreement were wide, indicating that there was large between-person variation in the accuracy of estimates.
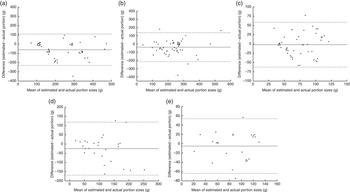
Fig. 1 Bland–Altman plots showing the mean difference (——) and 95 % limits of agreement (– – –) between estimated and actual portion sizes for (a) rice (n 47), (b) thick maize porridge (n 52), (c) shrimp sauce (n 47), (d) cowpea sauce (n 27), and (e) fish sauce (n 25). Adolescent girls aged 13–18 years, Zambezia Province, Mozambique, September 2009
Discussion
Accurate portion size estimation is a key to successful 24 h recall data collection. However, estimation of the portion sizes consumed is a challenging task for the subject. In the present study the validity of using a small photograph series in the assessment of portion sizes among Mozambican adolescent girls was evaluated.
As shown in the Bland–Altman plots, there was a rather large variation in the accuracy of the estimates between individuals. The proportions of participants who were able to give estimates within ±10 % of the actual portion size were somewhat modest, ranging from 20 % to 38 % for different foods. In dietary assessment, measurement error has two consequences relevant to epidemiological studies: (i) a proportion of subjects will be misclassified according to their food consumption and dietary intake; and (ii) the distribution of reported intakes will be wider than the distribution of the true intakes. The first of these two errors is more consequential. In the present study, the numbers of participants being classified into the opposite thirds of the distribution of consumption were small for all foods. Therefore it seems that even when errors occur, the ability to rank individuals according to their consumption remains satisfactory.
When all foods were grouped together, the mean percentage difference showed underestimation by 5 % of the weight of the food. This error is in a similar range as reported for 4–16-year-olds in the UK, although in that study the use of food photographs resulted in overestimation(Reference Foster, Matthews and Lloyd12). With regard to individual foods, the percentage differences were also of similar range as reported for 18–90-year-olds in the UK(Reference Nelson, Atkinson and Darbyshire10). The latter study showed a tendency to overestimate small portions and underestimate large portions.
Huybregts et al. (Reference Huybregts, Roberfroid and Lachat16) assessed the validity of using food photographs depicting foods in four different portion sizes among 15–45-year-old women in rural Burkina Faso. The women were served portions with the same weight as one of the photographs and the following day they were asked to estimate the portion sizes with the aid of the photographs. The authors found that 55 % of the estimates were correct, and the results indicated that there were large differences between individuals in the ability to report portion sizes. They reported that when a larger portion was served, the women were more likely to choose an incorrect photograph than in the case of smaller portions. The results of the present study are in line with this observation.
The study in Burkina Faso(Reference Huybregts, Roberfroid and Lachat16) also showed that women who attended school were more likely to choose a correct photograph. However, the study in South Africa(Reference Venter, MacIntyre and Vorster15) showed no significant differences in the percentages of correct responses between education levels. The present study provided only marginal evidence for an association between years of education and the ability to estimate portion sizes of staple foods accurately and no such association was found for sauces. Further work is needed to evaluate the effect of education on the accuracy of estimates in Mozambican and other Sub-Saharan African population groups.
In a real dietary study situation using the 24 h recall method, there are two main tasks required by the subject in portion size estimation: (i) memory of the foods eaten and (ii) conceptualization (i.e. the ability to translate an abstract mental impression of an amount eaten into an amount depicted in a photograph)(Reference Nelson and Haraldsdóttir17). In the present study the interviews were done immediately after the meal. Therefore, unlike in a real situation, the role of memory in the present study is very small and the results mainly describe the aspect of conceptualization.
The scaling of the photograph may affect the subject's ability to conceptualize the amount they have eaten. Most of the previous studies have used photographs in reduced scale and only few have tested life-sized photographs. Kirkcaldy-Hargreaves et al. (Reference Kirkcaldy-Hargreaves, Lynch and Santor18) used life-sized colour pictures and found that their validity was similar to or slightly higher than that for life-sized food drawings, soft plastic food models and models with abstract shapes. In South Africa, Venter et al. (Reference Venter, MacIntyre and Vorster15) tested near life-size (A4) photographs and found relatively good results: 68 % of the estimates were within ±10 % of the actual portion size. However, due to the differences in the experimental design, it is difficult to compare the results with the present study. In the South African study, the participants were shown portions of food that were exactly the same weight as those on the photographs and the estimations were done simultaneously.
Nelson et al. (Reference Nelson, Atkinson and Darbyshire19) found no apparent differences in the validity of estimates by adults and elderly persons in the UK using photograph series of two different sizes (A6, 100 mm× 200 mm; A7, 75 mm× 100 mm), but it may not be appropriate to generalize those results to all study settings. The setting of the present study was different from those in many high-income countries in the regard that photographs do not seem to play an import role in the everyday life of adolescent girls in Zambezia. In the present study, life-sized food photographs were produced as an attempt to provide the participants with photographs that portray foods in a scale that would seem natural to them. However, in the light of the present results it could be speculated that the life-sized photographs may actually have led the participants to perceive the large mounds or balls of staple foods as ‘too large’ and thus may have created a source of error in the estimation. In the future, it may be useful to test food photographs with a reduced scale also in Mozambique.
In the present study, white plates were used in the photographs of rice and thick maize porridge. These staple foods are light in colour, and using a plate of different colour might have resulted in better contrast between the food and the plate. Another possible improvement might be to change the weights of the portions in the photographs. In the present study, the increase of the portion size from the ‘small’ to ‘medium’ or from the ‘medium’ to ‘large’ photograph may not, in some cases, have been as clearly perceptible as possible. This might be one of the reasons why in the case of shrimp sauce, a large proportion of the participants were classified in adjacent thirds of the distribution. In the future, more attention should be paid to the differences between the portion sizes portrayed in the photographs.
Conclusions
The results of the present study show that adolescent Mozambican girls tended to underestimate especially the larger portions of staple foods. With regard to sauces, both under- and overestimation occurred frequently, but on the group level, the differences between the estimated and actual potions were small or acceptable. The ability to rank participants into thirds of the distribution according to their consumption was satisfactory, except for one food. Individual-level data on food consumption and dietary intake collected with methods based on estimated rather than weighed portion size information should be used and interpreted cautiously. Aids for estimating portion sizes that are appropriate in the local context, convenient to use and produce estimates with a good accuracy are essential in dietary assessment. Further work to develop and test sets of food photographs for use in different areas and population groups in Sub-Saharan Africa is needed.
Acknowledgements
Source of funding: The study was supported by the Academy of Finland, the Finnish Cultural Foundation and the Finnish Graduate School on Applied Bioscience: Bioengineering, Food & Nutrition, Environment (ABS). Conflicts of interest: The authors have no conflicts of interest to declare. Authors’ contribution: L.K., M.E. and M.M. designed the study. L.F. and L.K. coordinated the field work. L.K. was responsible for the data analysis and wrote the first version of the manuscript. J.N. provided statistical expertise. All authors contributed to revising the manuscript and approved the final version. Acknowledgements: The authors are grateful to Mr Paulo Cordeiro, the field team and families involved in the field work for their assistance, and thank the adolescent girls for their participation in the study.


