


Excess weight is prevalent among older adults in the USA, where over 70 % of adults aged 60 years and older are classified as overweight (BMI=25·0–29·9 kg/m2) or obese (BMI≥30·0 kg/m2)( Reference Ogden, Carroll and Kit 1 ). This is an important public health issue because obesity has been shown to increase the risk of morbidity and mortality and to reduce quality of life in adults( Reference Aronne 2 , Reference Villareal, Apovian and Kushner 3 ). Specifically, older adults with overweight or obesity have higher rates of physical impairments as a result of increased load on weight-bearing joints( Reference Runhaar, Koes and Clockaerts 4 ). Additionally, obesity-related metabolic dysfunction is known to impact the bioenergetic capacity of skeletal muscle that could indirectly contribute to physical impairment( Reference Furukawa, Fujita and Shimabukuro 5 – Reference Beavers, Miller and Rejeski 8 ). Evidence also links obesity to increases in co-morbidities such as CVD( Reference Hubert, Feinleib and McNamara 9 ), depression( Reference Faith, Matz and Jorge 10 ) and diabetes( Reference Ford, Williamson and Liu 11 ), all of which potentially limit physical function. The combination of these direct and indirect effects of obesity on increased rates of physical impairment in older adults is a major public health challenge that has a large impact on costs and quality of care in health systems.
Current studies have shown that body weight increases gradually over the lifespan and then plateaus at about 60 years of age( Reference Flegal, Carroll and Ogden 12 , Reference Flegal, Carroll and Kit 13 ). Emerging literature links early history of increased weight and weight changes across the life course with physical impairment later in life. A few studies have shown that individuals with overweight or obesity in middle age have greater difficulty performing activities of daily living later in life than their normal-weight counterparts( Reference Backholer, Pasupathi and Wong 14 – Reference Peeters, Bonneux and Nusselder 16 ). Another study reported that weight gains leading to obesity over 20 years were associated with higher disability in activities of daily living( Reference Williams, Eastwood and Tillin 17 ). Moreover, history of obesity in middle adulthood has been noted as a predictive marker of mobility disability( Reference Launer, Harris and Rumpel 18 ) and low muscle strength( Reference Stenholm, Sallinen and Koster 19 ) later in life. Weight history across the lifespan in women is particularly important because women live longer and experience greater rates of physical impairments for prolonged periods compared with men( Reference Hung, Ross and Boockvar 20 , Reference Murtagh and Hubert 21 ). Additionally, initial evidence suggests that a history of obesity impacts health and physical capacity to a greater extent in women following menopause, suggesting this group is particularly vulnerable to physical impairment( Reference Bouchard, Senechal and Slaught 22 ). Lastly, while body weight seems to plateau after the age of 60 years, the prevalence of obesity among women in this age group has risen from 31·5 to 38·1 % between 2003 and 2012( Reference Ogden, Carroll and Kit 1 ). This finding raises the question of whether maintenance of normal weight throughout life is associated with better physical function later in life among postmenopausal women. Weight history and weight transitions over the lifespan, and the effects on later-life physical impairment, could inform the development of novel prevention strategies and therapeutic interventions towards preserving functional independence among postmenopausal women.
To address this knowledge gap, the primary aim of the present study was to evaluate the association of weight status at age 18 years with severe physical impairment (SPI) in a prospective cohort of postmenopausal women. We hypothesized that higher BMI at age 18 years would be associated with higher likelihood of SPI in later life. The secondary aim of the study was to investigate the association between weight transitions during young adulthood and middle age and SPI later in life. We hypothesized that women who gained weight would have a higher likelihood of SPI later in life compared with women who maintained their weight. We also hypothesized that women who lost weight over time would be less likely to have SPI compared with women who remained of normal weight.
Methods
Study population
The Women’s Health Initiative (WHI) Observational Study (OS) addresses major causes of morbidity and mortality and their risk factors in postmenopausal women. Details of the study have been reported elsewhere( 23 ). Briefly, a total of 161 808 eligible women aged 50–79 years old were involved with either a clinical trial or the OS. The current analysis focused on OS participants (n 93 676), enrolled between 1994 and 1998. About 19 % of the sample did not have self-reported weight/height history (n 5448) or self-reported physical function (n 12 212) and were excluded from the analysis, resulting in an analytic sample of 76 016 postmenopausal women. Those who were excluded were younger, non-white, less educated, and reported less income. The protocol and consent forms were approved by the institutional review board at each site and all participants provided written informed consent prior to participation.
Weight history
At baseline, participants reported their height and weight at age 18 years old. Weight transitions were calculated using weight measured at the first year of follow-up, which was self-reported by participants to maintain the same mode of measurement with the historical assessments (Fig. 1). BMI (kg/m2) was calculated and categorized according to the WHO classifications: underweight (BMI<18·50 kg/m2), normal weight (18·5≤BMI<25·0 kg/m2), overweight (25·0≤BMI<30·0 kg/m2) and obese (BMI≥30·0 kg/m2). Adult lifespan BMI class change was calculated based on a shift in BMI class starting from age 18 years to current weight at the first WHI follow-up visit. Overweight and obese BMI classes at age 18 years were collapsed due to a low number of obese women at youth and few women who transitioned to other BMI classes over time.
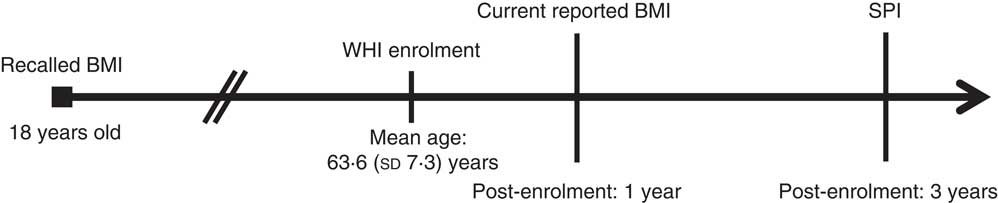
Fig. 1 BMI and severe physical impairment (SPI) assessment timeline among Women’s Health Initiative (WHI) participants, depicting when measures used to calculate BMI and SPI were collected
Severe physical impairment
SPI was assessed using the Physical Functioning subscale of the Rand thirty-six-item Short-Form Health Survey (SF-36). The SF-36 was initially collected at the third year of follow-up. Participants were asked ten questions about engagement in daily activities. These questions evaluated limitations in vigorous activities (i.e. running, lifting a heavy object or engaging in strenuous sports), moderate activities (i.e. moving a table, vacuuming, bowling or golfing), lifting or carrying groceries, climbing several flights of stairs, climbing one flight of stairs, bending/kneeling/stooping, walking more than a mile, walking several blocks, walking one block and bathing/dressing. Participants indicated whether they had no, little or a lot of limitation for each question. Each question was scored 0 to 10, where no, little or a lot of limitation garnered a score of 10, 5 and 0, respectively. A total summary score of 0 to 100 was calculated from the questions where a higher score indicated better physical function( Reference Ware and Sherbourne 24 ). As an example, someone who reported a lot of limitation in climbing several flights of stairs, bending/kneeling/stooping and walking more than a mile, while reporting a little limitation in all other categories, would receive a score of 35. SPI was calculated as a physical function score of less than 60( Reference Ware and Sherbourne 24 , Reference Bohannon and Depasquale 25 ).
Covariates for analysis
Covariates included demographic factors, lifestyle factors, medical history items and current medications. Race/ethnicity was self-described as white (non-Hispanic), American Indian/Alaskan native, Asian/Pacific Islander, Black/African American or Hispanic/Latina. Marital status was defined as never married, divorced/separated/widowed or presently married/living as married. Education was defined as no education to high-school diploma, education after high school, or college degree and higher. Income was stratified into five categories: less than $US 20 000; $US 20 000–34 999; $US 35 000–49 999; $US 50 000–74 999; or $US 75 000 and greater. Occupation was stratified into four roles: manager, administrative, service/labour or homemaker. Living status was defined as currently living alone or not.
Lifestyle factors included excessive alcohol consumption (defined as >7 drinks/week), history of tobacco smoking and health status (i.e. excellent, very good, good, fair or poor). Self-reported physical activity was derived as two covariates: participation in moderate and strenuous recreational physical activity (minutes/week) at WHI baseline and whether the participant engaged in strenuous physical activity between the ages of 15 and 19 years. Total energy intake was measured by daily kilocalories from the FFQ recalled over the past 3 months( Reference Patterson, Kristal and Tinker 26 ).
Additionally, medical history items included as covariates were: menopause age; number of pregnancies lasting at least 6 months; depressive-like symptoms measured on the shortened Center for Epidemiologic Studies–Depression (CES-D) scale ranging from 0 to 1 where higher scores indicate higher likelihood of depression; number of falls in the past year; history of CVD defined as having coronary revascularization, myocardial infarction or angina; history of congestive heart failure; history of hypertension as never, currently untreated or currently treated; history of diabetes as ever been treated for diabetes with pills or shots; chronic obstructive pulmonary disease defined as having emphysema, chronic bronchitis or asthma; history of stroke; history of thyroid gland problems; history of any type of cancer; history of arthritis; and history of any type of fracture. Cardiovascular, cancer and stroke events were adjudicated locally and centrally during the WHI study. Current medications known to influence body weight were also included as they would theoretically influence the lifetime weight difference calculation. These included hormone therapy defined as using oestrogen or progesterone from only pills and patches; oral use of glucocorticosteroids; contraceptives; psychotropic drugs (antipsychotics, antidepressants and mood stabilizers); beta-blockers; anticonvulsants; and anti-migraine drugs.
Validity of self-reported body weight and height
We examined the accuracy of self-reported body weight by comparing self-reported body weight by women aged 50 years old at the time of weight recall (for their weight at age 50) and clinically measured weight using calibrated scales in the clinic by certified staff (sub-sample of 1926 women). There was a high correlation (r=0·91) between self-reported weight and measured weight; however, these women systematically under-reported their weight by a mean of 1·89 (sd 0·20) kg.
Statistical analysis
Baseline characteristics were stratified by BMI (i.e. underweight, normal weight, overweight and obese) at age 18 years. Groups were compared using χ 2 analysis for categorical variables and one-way ANOVA for age at menopause, a continuous variable verified to be normally distributed. Logistic regression models estimated the association of BMI at age 18 years and current SPI (odds ratio and 95 % confidence interval). Logistic regression models were also used to examine the likelihood of SPI for becoming underweight, normal weight or overweight/obese at Year 1 of follow-up compared with maintaining weight from 18 years old. Models were constructed in four successive stages to evaluate the effect of the covariates. The first model adjusted for demographics, the second model adjusted for demographics with lifestyle factors, the third model adjusted for demographics, lifestyle factors and medical history items, and the final model adjusted for demographics, lifestyle factors, medical history items and current medications. Statistical analyses were performed using the statistical software package STATA version 13.
Results
Characteristics
Participant characteristics are shown in Table 1. Postmenopausal women reporting overweight or obesity at age 18 years tended to be younger, African American, non-Hispanic, not married, obtained less than a high-school education, had low income and lived alone. They were also more likely to report a history of tobacco smoking, poorer health status, being physically inactive, having higher energy intake, and being physically inactive between 15 and 19 years of age. Participants with overweight or obesity at age 18 years were more likely to have a history of medical conditions such as thyroid disorder, CHD, congestive heart failure, stroke, diabetes, hypertension, arthritis, depressive-like symptoms, and tended not to have pregnancies lasting 6 months or more. They also tended to take more medications known to affect weight such as psychotropic drugs, beta-blockers and anticonvulsants.
Table 1 Characteristics of postmenopausal women (n 76 016) by BMI class at age 18 years, Women’s Health Initiative Observational Study

MVPA, moderate-to-vigorous physical activity; PA, physical activity; CES-D, Center for Epidemiologic Studies–Depression scale.
* High energy intake defined as ≥7226 kJ/d (≥1727 kcal/d), where this range represents the highest tertile of dietary intake.
† Fracture defined as any fracture of the hip, upper leg, pelvis, knee, lower leg, ankle, foot, tailbone, spine or back, lower arm or wrist, hand, elbow, upper arm, shoulder or other.
BMI at age 18 years and severe physical impairment at older age
After adjusting for demographic factors, the odds ratio of SPI for those with underweight at 18 years old was not significantly different from that among participants with normal BMI at 18 years old (Table 2). The odds ratio of SPI for participants with overweight or obesity was significantly greater than that for participants with normal weight at 18 years. After fully adjusting for lifestyle factors, medical history and medications, the effects decreased slightly but remained significant in women with overweight and obesity.
Table 2 Severe physical impairmentFootnote * in relation to BMI class at age 18 years among postmenopausal women, Women’s Health Initiative Observational Study
Model 1 adjusted for demographic factors including age at baseline, race/ethnicity, marital status, income, education, occupation and living status.
Model 2 adjusted for model 1 covariates and behavioural factors including smoking status, alcohol intake, current physical activity, physical activity during youth, total daily energy intake and self-reported health.
Model 3 adjusted for model 2 covariates and medical factors including history of CHD, congestive heart failure, stroke, diabetes, hypertension, arthritis, cancer, chronic obstructive pulmonary disease, any fracture, falls in the last 12 months, depression, age at menopause and number of term pregnancies.
Model 4 adjusted for model 3 covariates and medications including contraception, hormone therapy, glucocorticosteroids, psychotropic drugs, beta-blockers, anticonvulsants and anti-migraine drugs.
* Severe physical impairment defined as score of less than 60 on the Physical Functioning subscale of the Rand thirty-six-item Short-Form Health Survey.
Distribution of weight change transitions
Approximately 61 % participants who self-reported being underweight at 18 years old transitioned into the normal BMI category at the Year 1 follow-up, while 26 % transitioned into the overweight BMI class (Table 3). Most participants who self-reported having normal weight at 18 years old either stayed normal or transitioned to overweight or obese at Year 1. Nearly half of the participants who self-reported being overweight at 18 years old transitioned to the obese BMI class or maintained an overweight BMI. Participants with self-reported obesity at age 18 years generally maintained obesity or transitioned into the overweight class. Only 13 % with self-reported obesity at age 18 years shifted to the normal BMI class over time. A sensitivity analysis that adjusted for body weight changes occurring between the ascertainment of current weight and SPI (from Year 1 to Year 3) did not alter the results (data not shown).
Table 3 Cross-tabulation of BMI class in late life according to BMI class at age 18 years among postmenopausal women (n 76 016), Women’s Health Initiative Observational Study

Weight change transitions over lifetime and severe physical impairment at older age
The odds of SPI at Year 3 follow-up was greater for women who transitioned from early-age underweight status to overweight/obese compared with those who remained in the underweight BMI class, with successive adjustment for demographic factors, behavioural factors, medical factors and medications (Table 4). Women who transitioned from normal weight to either underweight or overweight/obese had excess odds of SPI when compared with those who maintained a normal weight. Women with overweight/obesity who transitioned to a normal weight had reduced odds of SPI when compared with those who remained overweight/obese.
Table 4 Severe physical impairmentFootnote * in relation to change in BMI class from age 18 years to late life among postmenopausal women (n 76 016), Women’s Health Initiative Observational Study

Model 1 adjusted for demographic factors including age at baseline, race/ethnicity, marital status, income, education, occupation and living status.
Model 2 adjusted for model 1 covariates and behavioural factors including smoking status, alcohol intake, current physical activity, physical activity during youth, total daily energy intake and self-reported health.
Model 3 adjusted for model 2 covariates and medical factors including history of CHD, congestive heart failure, stroke, diabetes, hypertension, arthritis, cancer, chronic obstructive pulmonary disease, any fracture, falls in the last 12 months, depression, age at menopause and number of term pregnancies.
Model 4 adjusted for model 3 covariates and medications including contraception, hormone therapy, glucocorticosteroids, psychotropic drugs, beta-blockers, anticonvulsants and anti-migraine drugs.
* Severe physical impairment defined as score of less than 60 on the Physical Functioning subscale of the Rand thirty-six-item Short-Form Health Survey.
Discussion
The present analysis evaluated the association of weight history and transitions between BMI classes with SPI among postmenopausal women. We observed that women with both overweight and obesity at 18 years of age had a higher likelihood of SPI later in life. Moreover, underweight BMI status at 18 years old was not associated with SPI later in life. Women who transitioned from normal BMI to overweight or obese, compared with women who retained normal BMI, had greater odds of SPI. We also found women with normal BMI at age 18 years who transitioned into underweight status had a greater likelihood of SPI as compared with women who maintained normal BMI. It is important to note that a gain or loss in body weight is associated with SPI, suggesting that body weight is a powerful predictor of physical impairment.
The weight history findings are consistent with previous work examining the effect of adulthood BMI on late-life physical impairment. For example, one study found the greatest risk of physical impairment occurred in women who reported a history of middle-aged obesity( Reference Backholer, Pasupathi and Wong 14 ). Another study found that having higher BMI prior to old age increased the risk for physical impairment among older women( Reference Launer, Harris and Rumpel 18 ). These effects are supported by previous work demonstrating that longer exposure to excess body weight is associated with a higher likelihood of muscle weakness as measured by grip strength, a strong predictor of physical function( Reference Stenholm, Sallinen and Koster 19 ). Other studies which examined early adulthood weight found similar effects across various measures of physical function such as physical performance and mobility limitation( Reference Houston, Stevens and Cai 15 , Reference Houston, Ding and Nicklas 27 , Reference Strandberg, Strandberg and Salomaa 28 ). Therefore, the present study adds to the existing literature by further supporting the modest to strong effect of excess body weight in early life on late-life physical impairments.
Evaluating the consequences of body weight transitions from early life to later age on SPI is an important contribution of the present study. We found that transitions from normal BMI in early age to either underweight or overweight/obese BMI increased the odds of SPI compared with remaining within a normal BMI. These results are supported by another study reporting similar effects regarding weight gain over 4 years and increased odds of physical impairment among older women( Reference Fine, Colditz and Coakley 29 ). The authors also noted that women with overweight who lost weight improved physical functioning scores on the SF-36, which was similar to our findings showing that participants who transitioned from being overweight/obese had reduced likelihood of SPI. Similarly, another study demonstrated an association between weight gain from early to middle adulthood and functional limitations in late adulthood( Reference Houston, Stevens and Cai 15 ). Our results remain congruent with previous work, noting that transitioning into higher BMI classes increases the likelihood of SPI among postmenopausal women. We also found that women who self-reported being underweight in early adulthood and transitioned to being either overweight or obese increased their likelihood of late-life physical impairment. Additionally, the literature has not fully examined how weight loss in women with normal weight, particularly those who transition to a lower BMI class, can impact physical function. This finding might be related to underlying clinical or subclinical conditions associated with weight loss and the onset of SPI( Reference Marton, Harold and Krupp 30 ). To our knowledge, this is a unique finding in understanding the factors associated with late-life physical impairment in postmenopausal women.
Obesity is known to increase the risk of developing a variety of medical illnesses connected to onset of physical impairment in later life. With regard to mobility, obesity is clearly linked to the pathogenesis of cartilage degeneration in osteoarthritis, specifically in weight-bearing joints, a major cause of physical impairment in older adults( Reference Hart and Spector 31 ). Obesity early in life is also associated with structural changes in the feet, plantar fat pad and plantar pressures which are known to impair gait and mobility function( Reference Hart and Spector 31 – Reference Nass, Henning and Van Treek 33 ). Additionally, obesity during childhood negatively impacts lower limb strength and power, where additional mass requires more effort to move against gravity, also interfering with normal gait mechanics of carrying excess weight( Reference Hills, Hennig and McDonald 34 ). Moreover, metabolic dysfunction, another predictor of functional impairment in older adults, is a hallmark condition of young adults with obesity( Reference Dowling, Steele and Baur 35 ). Other obesity-linked conditions such as hypertension, CVD, pulmonary disease, cancer and cataracts are also associated with physical impairment in older adults( Reference Villareal, Apovian and Kushner 3 , Reference Després 36 , Reference Sinclair, Conroy and Bayer 37 ). Because obesity is associated with earlier onset of co-morbidities, we speculate that lifetime obesity increases this exposure and partly explains the increases in odds of developing SPI in postmenopausal women. Although we adjusted for disease factors, we were unable to adjust for the onset or the duration of these diseases, which would affect physical function later in life. The underlying reasons for these associations are likely a culmination of all these factors.
Main strengths of the present study included a large sample size and the availability of many potential confounders utilized to examine the association of weight and physical impairment in postmenopausal women. This allowed us to adjust for many important variables including demographics, lifestyle factors, chronic illnesses, depressed mood and medications. Another strength of the study was the longitudinal collection of data, which enabled examination of life-course weight class transitions that are associated with later-life SPI likelihood.
There are limitations to our study that should be acknowledged. Results should be considered in the context of a retrospective cohort design that cannot fully assess the temporality of an association (i.e. cause and effect). Physical impairments were captured in late life, thus the analysis does not consider pre-existing impairments (i.e. onset before age 18 years or before WHI enrolment). Also, factors causing physical impairments and treatments that could positively impact physical function (e.g. hip replacement) were not ascertained between the assessments for self-report body weight (Year 1) and physical function (Year 3). Similar to most cohort studies, the WHI suffers from volunteer bias where volunteers tend to have a higher education and income than a representative sample( Reference Boughner 38 ). Additionally, there were missing data that was more likely to occur in less educated and non-white women, which should be considered when generalizing these results. Information bias is a concern for the study considering participants were asked to recall their body weight. For example, we noted that women under-reported their weight by 2 kg. However, there are a few considerations that might minimize this bias. First, there is extensive research to support self-reported weight and height as sufficient for BMI categorization( Reference Stewart 39 – Reference Stunkard and Albaum 41 ) and evidence suggests older women accurately recall their body weight at youth( Reference Perry, Byers and Mokdad 42 , Reference Stevens, Keil and Waid 43 ). Second, there was a strong correlation between self-reported weight and actual weight in this sample (r=0·91). Third, the error in self-reported weight is attenuated by examining the differences within participants. Lastly, we expect that under-reporting would occur in women who reported being underweight or normal weight at 18 years of age. Under-reporting directional bias is most likely to occur in women who reporting being under- or normal weight at 18 years of age. The transitions into higher BMI categories among these groups as well as the effect on physical function could impact the statistical estimates in the null direction. Under-reporting bias could also accentuate the estimates if women under-reported their weight at age 18 years and subsequently transitioned into a higher body weight class. Finally, weight changes that occurred over adulthood were not known to be intentional or unintentional, leading to difficulty in interpreting whether weight transitions were related to clinical and/or behavioural changes that would aid in creating a more specific public health recommendation.
Our findings suggest that maintenance of healthy weight during adulthood might reduce the likelihood of SPI later in life. Physical impairments and disability are a major public health issue in older adults, and the present results demonstrate that higher weight in early life and weight gain throughout life are major contributors of physical impairment in older women. Conversely, weight loss in young women with overweight and obesity was strongly connected to reduced likelihood of physical impairment in later life. These results suggest that intervention strategies to prevent weight gain early in life and to maintain a healthy body weight throughout life will help to prevent or delay the onset of SPI in postmenopausal women.
Acknowledgements
Acknowledgements: Program Office (National Heart, Lung, and Blood Institute, Bethesda, MD): Jacques Rossouw, Shari Ludlam, Dale Burwen, Joan McGowan, Leslie Ford, Nancy Geller; Clinical Coordinating Center (Fred Hutchinson Cancer Research Center, Seattle, WA): Garnet Anderson, Ross Prentice, Andrea LaCroix, Charles Kooperberg. Investigators and academic centres (Brigham and Women’s Hospital, Harvard Medical School, Boston, MA): JoAnn E. Manson; (MedStar Health Research Institute/Howard University, Washington, DC): Barbara V. Howard; (Stanford Prevention Research Center, Stanford, CA): Marcia L. Stefanick; (The Ohio State University, Columbus, OH): Rebecca Jackson; (University of Arizona, Tucson/Phoenix, AZ): Cynthia A. Thomson; (University at Buffalo, Buffalo, NY): Jean Wactawski-Wende; (University of Florida, Gainesville/Jacksonville, FL): Marian Limacher; (University of Iowa, Iowa City/Davenport, IA): Robert Wallace; (University of Pittsburgh, Pittsburgh, PA): Lewis Kuller; (Wake Forest University School of Medicine, Winston-Salem, NC): Sally Shumaker; Women’s Health Initiative Memory Study (Wake Forest University School of Medicine, Winston-Salem, NC): Sally Shumaker. Financial support: The WHI programme is funded by the National Heart, Lung, and Blood Institute, National Institutes of Health, US Department of Health and Human Services (contract numbers HHSN268201100046C, HHSN268201100001C, HHSN268201100002C and HHSN268201100003C, HHSN268201100004C). M.E.W. was supported by the National Institutes of Health (grant number KL2TR000160). Conflict of interest: A.A.W., S.S.S., R.N., L.G., J.W.B., J.K.O., R.A.S. and G.E.S. have nothing disclose. M.J.L. (grant number R03DE022654), M.E.W. (grant numbers KL2TR000160 and U01HL105268), M.L.S. (grant numbers P30CA124435 and U01AR045583), M.L. (grant number N01WH42129-24-01) and T.M.M. (grant numbers R01AG042525 and P30AG028740) were supported by the National Institutes of Health during study conduct. Authorship: A.A.W., S.S. and T.M.M. worked on study design and methods. A.A.W. and S.S. were responsible for data analysis while T.M.M. supervised analysis. A.A.W. wrote the paper and all authors provided feedback and approved the final manuscript. Ethics of human subject participation: The study protocol and consent forms were approved by the institutional review board at each WHI site, and all participants provided written informed consent prior to participation.


