


In 1974, the infant mortality rate (IMR) for twins in Japan was reportedly higher in like-sexed than in unlike-sexed twins (Imaizumi et al., Reference Imaizumi, Inouye and Asaka1981). Imaizumi (Reference Imaizumi2001) also reported IMRs for singletons and twins during 1995–1998 when the IMR was five-fold higher in twins than in singletons. Risk factors for the IMR in twins were males, second-born twins, and lower birth weight (BW).
The purpose of this study was to identify risk factors for infant mortality in singletons and twins using vital statistics data from 1999 to 2008. Risk factors were sex, maternal age, gestational age (GA), BW, and birth order of twins.
Materials and Methods
Infant mortality data were obtained from Japanese Vital Statistics for 1999–2008 (Health and Welfare Statistics and Information Department, Ministry of Health, Labour and Welfare, Japan), which covers the entire Japanese population. The infant death certificate records provide information concerning nationality, sex, dates of birth and death, BW, maternal age, GA, single or multiple birth, birth order of multiple births, cause of death, and other details. Early neonatal mortality (ENM) refers to the death of a live-born baby within the first 7 days of life, whereas late neonatal mortality (LNM) covers the time after 7 days until before 28 days. The sum of these two represents neonatal mortality (NM). The ENM rate (ENMR) and NM rate (NMR) define the number of ENM and NM per 1,000 live births, respectively. In contrast, the LNM rate (LNMR) defines the number of LNM per 1,000 survivors. Odds ratio (OR) and 95% confidence intervals (CIs) were used to test mortality rates between singletons and twins.
The numbers of infant deaths excluded were 271 (6.8%) in 1999, 268 (7.0%) in 2000, 259 (7.2%) in 2001, 220 (6.3%) in 2002, 206 (6.1%) in 2003, 199 (6.4%) in 2004, 209 (7.1%) in 2005, 185 (6.5%) in 2006, 169 (6.0%) in 2007, and 192 (6.9%) in 2008. These data did not distinguish between singletons and multiple births.
Results
Infant Mortality Trends
Table 1 shows the number of infant deaths and IMRs for singletons and twins according to sex during 1999–2008. IMRs decreased significantly from 1999 (2.9 per 1,000 live births in singletons and 15.5 in twins) to 2008 (2.2 and 8.6, respectively). The IMR was 5.3-fold higher in twins than in singletons in 1999 and decreased to 3.9-fold in 2008. Subsequently, the IMR rapidly decreased in twins than in singletons. The overall IMR in singletons tended to be higher in males (2.7) than in females (2.4), but the difference was not significant at the 5% level. The IMR was significantly higher in male (12.6) than in female (10.5) twins. The overall IMR decreased to 26% in singletons and 45% in twins during the last decade.
TABLE 1 Yearly Change of Infant, Neonatal and the First Day Mortality Rates in Singletons and Twins, 1999–2008

Figures in parentheses indicate the percentage of neonatal deaths or deaths at the first day among total infant deaths in singletons and twins; CI = confidence interval; *Significant at the 5% level (males vs. females); Bs = Live births.
Table 1 also presents the NMR and first-day death rate in singletons and twins during 1999–2008. The NMR in singletons decreased significantly from 1.6 per 1,000 live births in 1999 to 1.1 in 2008. Similarly, the corresponding rates in twins were 11.2 in 1999 and 5.4 in 2008, which were significantly different. The first-day death rate decreased significantly year by year during the period for both singletons and twins. The proportion of first-day deaths among infant deaths was 18% for singletons and 22% for twins. Overall proportions of neonatal deaths among infant deaths were 54% for singletons and 74% for twins during 1999– 2008.
Neonatal and Infant Mortality by GA
Table 2 shows GA-specific ENMR, LNMR, and IMR in singletons and twins during 1999–2008. Categories of GA are as follows: <24, 24, 39, and ≥40 weeks. The ENMR decreased with GA from the shortest week (395.8 per 1,000 live births) to the longest week of gestation (0.3) in singletons, whereas the ENMR in twins decreased with GA from the shortest week (454.5) to 37 weeks (1.1) and increased thereafter (2.1 at 40 weeks and over). The ENMR was significantly higher in twins than in singletons during the period from the shortest GA (<24 weeks) to 26 and ≥38 weeks. In contrast, the ENMR was significantly higher in singletons than in twins for the GA of 29–36 weeks. The highest relative risk was 6.2-fold higher in twins than in singletons at ≥40 weeks and the second highest was 4.6-fold at 39 weeks, whereas the lowest risk in twins was 0.38-fold at 33 weeks of gestation and the second lowest was 0.4-fold at 32 and 34 weeks of gestation.
TABLE 2 Early Neonatal, Late Neonatal, and Infant Mortality Rates by Gestational Age in Singletons and Twins, 1999–2008
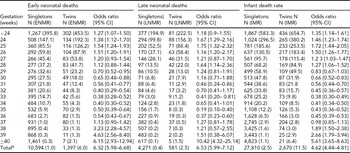
aIncluding unknown gestational age; ENMR = early neonatal mortality rate; LNMR = late neonatal mortality rate; IMR = infant mortality rate; CI = confidence interval.
The LNMR decreased with GA from the shortest (194.9 per 1,000 survivors) to the longest week of gestation (0.1) in singletons, whereas with three exceptions (32, 34, and 37 weeks of gestation), the LNMR in twins decreased with GA from the shortest week (222.5) to 39 weeks (0.2) and increased thereafter (1.5 at ≥40 weeks). The overall risk was 6.5-fold higher in twins than in singletons.
The IMR decreased with GA from the shortest (583.3 per 1,000 live births) to the longest week of gestation (1.1) in singletons, whereas the IMR in twins decreased with GA from the shortest week (654.7) to 37 weeks (2.8) and increased thereafter (6.4 at ≥40 weeks; Figure 1). The IMR was significantly higher in twins than in singletons during the period from the shortest (<24 weeks) to 28 as well as 38 weeks and over. In contrast, the IMR was significantly higher in singletons than in twins from 30 to 36 weeks of gestation. The highest risk was 5.6-fold higher in twins than in singletons at ≥40 weeks and the second highest was 2.7-fold at 39 weeks, whereas the lowest risk of twins was 0.38-fold at 33 weeks of gestation and the second was 0.41-fold at 34 weeks of gestation.

FIGURE 1 The infant mortality rates in singletons and twins according to risk factors, 1999–2008.
Maternal Age
Table 3 shows a comparison of mortality rates between singletons and twins according to maternal age group in ENMRs, NMRs, and IMRs. Regarding the ENMR, the highest rate was 2.27 per 1,000 live births for singletons aged ≥40 years and 12.6 for twins aged <20 years, whereas the lowest rate was 0.82 for singletons aged 25–29 years and 5.36 for twins aged 30–34 years. The relative risk of IMR in twins was 9.6-fold for the youngest mothers and decreased as maternal age group rose to 3.2-fold for mothers aged ≥40 years. The same tendency was also observed for the NMR and IMR. ENMRs, EMRs, and IMRs were also higher for mothers aged <25 years than for those aged ≥35 years in singletons, whereas opposite results were obtained in twins (Figure 1).
TABLE 3 Infant Mortality and Neonatal Mortality Rates by Maternal Age, 1999–2008

CI = confidence interval.
BW
Table 4 shows BW-specific IMRs in singletons and twins during 1999–2008. Categories of BW are divided into seven groups: <500, 500–999, 1,000–1,499, 1,500–1,999, 2,000–2,499, 2,500–2,999, and ≥ 3,000 g. For singletons, the IMR was 612 per 1,000 live births for <500 g and drastically decreased to 60 for 1,000–1,499 g, and the lowest IMR was 0.9 for ≥3,000 g. In contrast, the highest IMR in twins was 683 for <500 g and decreased to 1.82 for 2,500–2,999 g and increased thereafter to 3.25. The risk of IMR was significantly higher in twins than in singletons for four categories (<500, 500–999, 2,500–2,999, and ≥3,000 g). In contrast, the risk was significantly higher in singletons than in twins for 1,000–1,499, 1,500–1,999, and 2,000–2,499 g (Figure 1).
TABLE 4 Comparison Between Infant Mortality Rates for Singletons and Twins According to Birthweight, 1999–2008

IMR = infant mortality rate; CI = confidence interval.
GA and BW
Table 5 shows the IMR according to BW and GA in singletons and twins. Excluding the small number of infant deaths (<10), the OR between IMRs of twins versus singletons was computed for 44 categories (combinations of BW and GA = 80–36). The IMR was significantly higher in twins than in singletons for the category <500 g and 26 weeks of gestation, five categories of GA (24–27 weeks and 30 weeks) for 500–999 g, 1,000–1,499 g and 26 weeks, and ≥2,000 g and ≥38 weeks. However, the IMR was significantly higher in singletons than in twins for nine categories of GA (29–37 weeks) for 1,000–1,499 g, nine (from 30 weeks to ≥38 weeks) for 1,500–1,999 g, and five (33–37 weeks) for ≥2,000 g. The lowest IMR was 1.1 per 1,000 live births in singletons for the heaviest BW and longest GA where the proportion was 87% (9,550,618/11,024,236) among the number of live births and 41% (10,872/26,294) of infant deaths. In contrast, the lowest IMR in twins was 1.8 per 1,000 live births for the heaviest BW and 37 weeks of gestation, and the corresponding proportions were 29% (35,058/231,144) and 5% (122/2,655), respectively. The optimum condition of the IMR for singletons was the heaviest BW (≥2,000 g) and longest GA (≥38) and for twins, the heaviest BW and 37 weeks of gestation.
TABLE 5 Infant Mortality Rate According to Birthweight and Gestational Age (GA) in Singletons and Twins, 1999–2008

aIncluding unknown gestational age; *significant at the 5% level (twins vs. singletons).
Discussion
The relative risk for the IMR for twins compared with singletons was 5.3-fold in 1999 and decreased to 3.9-fold in 2008. The reduced risk of IMR in twins relative to singletons may be related to a part of the medical treatment for twin — twin transfusion syndrome now available in Japan (Imaizumi & Hayakawa, Reference Imaizumi and Hayakawa2012).
According to Luke and Brown (Reference Luke and Brown2007), IMRs in singletons and twins were higher in mothers aged <20 years than in those aged ≥40 years in the United States during 1995–2000. In the present study, identical results were obtained in twins, but in singletons, the opposite result was obtained. The IMR of twins by maternal age in 1975 was recomputed using Table 6 of Imaizumi et al. (Reference Imaizumi, Inouye and Asaka1981). The IMR was 50 (90/1,800) in mothers aged <25 years, 42.3 (164/3,869) for those aged 25–29 years, and 31.1 (64/2,056) for those aged ≥30 years. Furthermore, in 1975, the IMR in twins was higher in younger mothers in Japan. However, data in the United States were remitted, because the data used only full-term (37 weeks and over) and non-low BW (>2,500 g) infants. In Japan, the IMR in singletons was 1.16 per 1,000 live births (11,590/9,970,060) under the conditions of ≥37 weeks and >2,500 g during 1999–2008. On the other hand, the IMR in singletons was 1.98 per 1,000 live births under the same conditions in the United States.
Hansen and Kiely (Reference Hansen and Kiely1992) mentioned the importance of the first-day death rate in infant mortality in the United States (36% for the white and 41% for the black population). In the present study, the proportion of first-day deaths was 18% for singletons and 22% for twins. According to Imaizumi (Reference Imaizumi2001), the proportions of neonatal deaths were 54% for singletons and 77% for twins during 1995–1998, whereas in the present study, these values were 54% and 74%, respectively. The importance of the neonatal death rate was recognized for both singleton and twin births in Japan. Thus, the intensive care of singletons and twins during the neonatal period may therefore be very important to reduce the IMR.
Tobe et al. (Reference Tobe, Mori, Shinozuka, Kubo and Itabashi2011) studied early neonatal mortality during 2001–2005 in Japan. These twin data (n = 22,240) were collected from 147 secondary and tertiary hospitals in all 47 prefectures. They indicated that the risk factors for early neonatal mortality were GA, chorionicity (monochorionic or dichorionic), and mode of delivery (vaginal delivery or caesarean section). However, early neonatal mortality was similar for maternal age groups <35 years (3.12%) and ≥35 years (3.05%). In the current study, the corresponding values were 6.09% (1,113/182,702) and 5.72% (284/49,643), respectively. These values were not in significant at the 5% level (OR 1.07; 95% CI 0.93–1.21).
Acknowledgments
We are grateful to the staff of the Statistics and Information Department, Ministry of Health, Labour and Welfare, Japan.


