Surveys belong to the most popular research methods in legislative studies (Bailer Reference Bailer2014). Legislative surveys are particularly well established in Europe, while studies on the US Congress rather focus on the analysis of roll call vote data. In the age of big data, more and more information is available about members of parliaments’ (MPs) behavior. However, legislative behavior is often best understood by means of surveys, particularly when doing large comparative analyses. Surveys do not only provide information on the intention of MPs, but they also allow for drawing more wide ranging inferences by increasing the number of participants.
In the last couple of years, several studies have conducted surveys in order to study legislative behavior (Aelst, Sehata and Dalen Reference Aelst, Sehata and Dalen2010; Kam et al. Reference Kam, Bianco, Sened and Smyth2010; Martin Reference Massey and Tourangeau2010; Bowler and Farrell Reference Bowler and Farrell2011; Zucco and Lauderdale Reference Zucco and Lauderdale2011; Arnold Reference Arnold2012; Scully, Hix and Farrell Reference Selb and Munzert2012; Bailer et al. Reference Bailer, Meissner, Ohmura and Selb2013; Deschouwer and Depauw Reference DeMaio2014; Bütikofer and Hug Reference Bundi, Eberli, Frey and Widmer2015). Although legislative surveys are vulnerable to several methodological problems, they are rarely ever validated (Groves et al. Reference Groves, Fowler, Couper, Lepkowski, Singer and Tourangeau2011; Fowler Reference Fowler, Heaney, Nickerson, Padgett and Sinclair2013). In contrast to legislative studies, the validation of survey data is well established in other research areas, for example, postelection studies (Comşa and Postelnicu Reference Comşa and Postelnicu2013; Selb and Munzert Reference Sciarini and Goldberg2013; Sciarini and Goldberg Reference Scully, Hix and Farrell2015; Sciarini and Goldberg Reference Sciarini and Goldberg2016). These studies show that survey data tends to be biased. Similar problems are likely to populate legislative surveys. Krumpal (Reference Krumpal2013, 2027–8) argues that social desirability is especially developed when the answer is sensitive. Since MPs are especially aware of public opinion, they may be tempted to misreport due to social desirability. Hence, this article illustrates the methodological challenges of surveys in legislative research. In doing so, the article argues that self-selection and misreporting are the main issues when conducting a legislative survey and illustrates how relevant those effects are and that the attitude toward the object of inquiry has a main influence on survey results.
This article performs a triangulation in order to identify the effects of self-selection and misreporting. Concretely, we take advantage of two different data sources to assess survey reported and validated behavior of MPs: on the one hand, we carried out a survey about MPs’ demand for policy evaluation. In the survey, MPs were asked if they had submitted a request in order to evaluate the implementation or impact of a public policy.Footnote 1 In addition, such parliamentary request are also important for MPs who wants to fulfill their oversight function and control the government. On the other hand, we performed a content analysis of all MPs’ parliamentary interventions to determine if the respondent’s behavior was consistent with their answers. By comparing the self-reported and validated behavioral data, we are able to estimate the survey bias. The analysis shows that the survey sample is not affected by a self-selection bias, but the responses by misreporting. A comparative analysis suggests that the findings based on the survey systematically overestimate the effects of exogenous variables. As a consequence, the sample should be adjusted.
This article is structured as follows. First, second section discusses the advantages and the methodological challenges of legislative surveys. Third section introduces both data sources—the reported data from the survey and the validated data from the content analysis. Fourth section presents different models, which explain the over- and underreporting of the parliamentary demand for evaluations. In addition, a comparison between data sets shows the consequences of a biased survey sample for models that explain MPs’ behavior. Fifth section concludes by discussing the relevance of the findings for legislative research.
Legislative Surveys: An Opportunity With Challenges
Surveys are a useful tool to collect information on MPs. This technique offers two key advantages. First, surveys are relatively fast and inexpensive to conduct, particularly when performed online. While researchers may interview the MPs personally or send them a questionnaire by mail, scholars can also simply send MPs an invitation to an online survey to their official email address. In this way, MPs can choose a suitable time for them in order to answer the questions, and interviewer effects are almost inexistent (Bailer Reference Bailer2014, 177). Second, surveys generate data that otherwise would not be available. MPs’ behavior is generally well documented, but the motivation behind this behavior often remains unknown. Research projects regularly require the collection of latent information that is not readily or publicly available. Hence, researchers often have no alternative but directly to ask questions to MPs in order to produce manifest data. While in many scenarios interviews would also allow the collection of latent information, surveys bear the important advantage of being often more resource effective.
The advantages of surveys are indisputable. However, surveys often entail challenges that have to be dealt with. Since surveys often rely on samples and do not have a full response rate, the responding sample is rarely equal to the population of interest. Bethlehem (Reference Bethlehem2010, 163–5) has presented a taxonomy of survey biases (Figure 1). In doing so, he distinguishes between sampling biases and non-sampling biases. Sampling biases can be traced back to the sampling, since the estimation is based on a sample and not on the entire population. Two different types of biases are based on sampling biases. While estimation biases denote the effect caused by using a random selection procedure, self-selection bias occurs when the true selection probability differs from the selection probability specified in the sampling design. Non-sampling biases are the type of biases that are not related to the sample. Bethlehem further distinguishes between observation and non-observation biases. On the one hand, observation biases refer to biases made during the data collection and take different forms: overcoverage biases are made when units are included in the survey, which do not belong to the population of interest. Misreporting arises when a respondent does not want to give the accurate answer, when the respondent fails to give the accurate answers or when the respondent does not understand the question. Moreover, misreporting can also be caused by a lack of interest or an intention to provide a certain image. Processing biases are made during data processing (e.g., during data entry to a database). On the other hand, non-observation biases are either undercoverage biases or missing biases. Undercoverage occurs when members of the population of interest are not invited to participate. Missing biases refer to situations in which the respondents do not provide the required information.
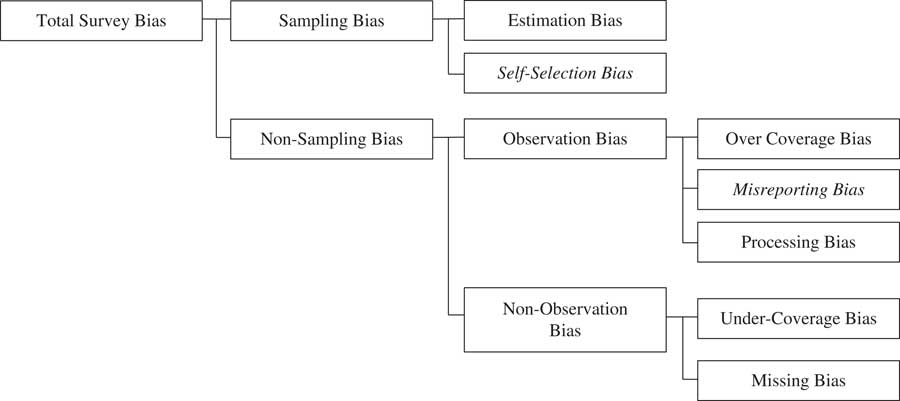
Fig. 1 Taxonomy of survey biases Note: Adopted from Bethlehem (Reference Bethlehem2010, 164).
Legislative surveys are a special form of survey, since they differ from other surveys such as household panels or postelection surveys. As a kind of elite surveys, they are shaped by special circumstances. We argue that two types of biases are of particular interest for legislative surveys. First, among the sampling biases is the self-selection bias more likely to appear than an estimation bias, since a legislative survey relies (usually) on an exhaustive sample. The sample is usually defined as the number of seats in the parliament. Since the numbers are relatively small, it is often not necessary to draw a sample from all MPs. Second, among the non-sampling biases, misreporting is the biggest challenge. While processing biases are highly dependent on the quality of the research, over- and undercoverage are unlikely due to the defined sample. Missing biases are not specific to legislative studies and they are well discussed in survey research (Little Reference Little1988; Little and Rubin Reference Little and Rubin2014). However, the MPs responses can be highly biased when their reported information is not accurate. Both self-selection and misreporting bias have two components: random and systematic bias. While the former is only problematic for standard errors, the latter is in addition problematic for the estimated values. Given the main challenges faced by legislative surveys, we focus in the following sections on self-selection and misreporting and illustrate how they may influence survey results.
Self-Selection Bias
The first challenge for every survey is to obtain a sufficient number of participants, as a high response rate is helpful to generate a non-selective sample. A high response rate often produces a more representative database than a lower one. In the last couple of years, rates of self-selection have generally increased (Brick and Williams Reference Brick and Williams2013, 36; Massey and Tourangeau Reference Martin2013, 222)—this trend can also be observed for surveys among MPs (Bailer Reference Bailer2014, 178).
Self-selection can have a strong influence on the viability of the data. Consequently, the likelihood of MPs to participate in a survey is important. Groves and Couper (Reference Groves and Couper2012), as well as Groves, Singer and Corning (Reference Groves, Singer and Corning2000) argue that single attributes of the survey may highly influence whether the invited person participates in the survey or not. In the leverage-salience theory, the decision to participate is dependent on the “leverage” of some attributes, to which the invited persons assign a different salience. When an attribute has a great leverage on the decision to participate for many invited persons, the sample is likely to have a self-selection bias (Groves and Peytcheva Reference Groves and Peytcheva2008, 169).
Misreporting Bias
If the invited persons have participated in the survey, the next challenge is to find out whether they have answered the questions accurately. Misreporting is either possible when the MP does not want to give the accurate answer or when he cannot give the true answer because he or she is not able to do it. Both result in the over- and underreporting of the accurate behavior. Overreporting occurs when a MP claims an action or belief that he or she did not undertake or share. In contrast, underreporting occurs when a MP neglects an action or belief, although he or she truly undertook or shares it. According to Belli et al. (Reference Belli, Traugott, Young and McGonagle1999, 90–1), two different sources of misreporting are discussed in literature: social desirability and memory failure. While social desirability indicates the tendency of a respondent to answer in a most social acceptable way (Crowne and Marlowe Reference Crowne and Marlowe1960; DeMaio Reference Deschouwer and Depauw1984; Tourangeau and Yan Reference Tourangeau and Yan2007), memory failure refers to the situation in which the respondent cannot remember an event (Groves et al. Reference Groves, Fowler, Couper, Lepkowski, Singer and Tourangeau2011).
Social desirability and memory failure are both linked to overreporting and underreporting (Groves et al. Reference Groves, Fowler, Couper, Lepkowski, Singer and Tourangeau2011, 218). Nevertheless, the reasons behind underreporting are much less clear. The literature simply suggests that respondents may underreport when the action or behavior is embarrassing or socially undesirable, as well as when there is a mismatch between the respondent’s and the survey’s understanding of the question (Tourangeau et al. Reference Tourangeau, Shapiro, Kearney and Ernst1997; Martin Reference Martin1999).
Jackman (Reference Jackman1999, 9–14) has formally defined the bias from self-selection and misreporting. First, he denotes that the survey estimate of x is not based on a full sample, but on the respondents’ sample. The estimation from the respondents subset is denoted x (r) and the value of x among the non-respondents x (~r) (each with weights r and (1−r)):
 $$x\,{\equals}\,rx^{{(r)}} {\plus}(1{\minus}r)x^{{(\sim r)}} {\plus}{\epsilon},$$
where ϵ denotes the error term due to sampling (which is in most of the cases for legislative surveys E(ϵ)=0). Second, the author denotes the attributes x that increases the probability to participate in the survey in general (e.g., knowledge or interest in the topic of the study), when x (r)≥x≥x (~r). The difference between the survey respondents and the non-respondents are reflected in the following model:
 $$x^{{(\sim\,r)}} \,{\equals}\,\omega x^{{(r)}} ,\,0\,\lt\,\omega \leq 1,$$
where ω is a non-response deflation parameter. Third, the measurement problem can be formulated with the difference between the true rate of x among respondents, x
(r) and the observed rate $\hat{x}^{{(r)}} $
. Thus, misreporting can be formulated as
$\hat{x}^{{(r)}} $
. Thus, misreporting can be formulated as
 $$x^{{(r)}} \,{\equals}\,{\rm \eta }\hat{x}^{{(r)}} .$$
Finally, we obtain the total bias of self-selection and misreporting when we substitute both Equations 2 and 3 in Equation 1:
 $$\eqalignno{ x\,{\equals}\, & rx^{{(r)}} {\plus}(1{\minus}r)x^{{(\sim r)}} {\plus}{\epsilon}{\rm \,{\equals}\,{\plus}(1}{\minus}r{\rm )}\omega \eta \hat{x}^{{{\rm (}r{\rm )}}} {\plus}r\eta \hat{x}^{{(r)}} {\rm {\plus}}{\epsilon} \cr {\equals}\, & \hat{x}^{{(r)}} \eta (r{\plus}\omega {\plus}r\omega ){\plus}{\epsilon}{\rm .} $$
The next section introduces the data and the methods that we use in order to demonstrate the bias for self-selection and misreporting for legislative studies.
Data and Methods
In order to analyze the biases of legislative surveys, we will compare the responses of a legislative survey with validated MP behavior. In doing so, we supplement the ParlEval survey data set (Eberli et al. Reference Eberli, Bundi, Frey and Widmer2014) with data of parliamentary interventions obtained by means of web scraping. The ParlEval survey was conducted among the cantonal and federal MPs in Switzerland in 2014. In total, 1570 MPs participated in the survey; this corresponds with a response rate of 55.3 percent.Footnote 2 Since we only analyze the federal level, we will use the responses of 112 members of the Federal Assembly (45.7 percent response rate). Both response rates are relatively high for legislative surveys in Switzerland (Brun and Siegel Reference Brun and Siegel2006; Bütikofer Reference Bundi2014; Deschouwer and Depauw Reference DeMaio2014; Strebel Reference Strebel2014; Feh Widmer Reference Feh Widmer2015).
The analysis in this paper validates the MPs’ responses to the survey with MPs’ behavior in terms of demand for policy evaluation. Evaluation requests are particularly useful for MPs because they provide evidence for legislative decision making and help MPs to fulfill their oversight function toward the government (Jacob, Speer and Furubo Reference Jacob, Speer and Furubo2015; Bundi Reference Bütikofer2016). Since MPs demand often evaluations by means of parliamentary interventions, the comparison of reported (survey responses) and validated data (submitted interventions) offers an optimal basis to estimate the effects of biases on the survey responses. In the survey, MPs reported whether they have requested policy evaluations by means of parliamentary interventions during the last four years (i.e., March 1, 2010 to June 20, 2014). In order to compare MPs’ reported demand for evaluationFootnote 3 with the actual MPs’ behavior, we have collected data on parliamentary interventions. In doing so, we have only included parliamentary interventions, which were issued by individual MPs. All the types of parliamentary interventions available to federal MPs (questions, interpellations, postulates, motions and parliamentary initiatives) introduced in the four years previous to the survey were downloaded from the Swiss Parliament websiteFootnote 4 and stored in a database.
During the four-year period mentioned above, 9203 interventions were introduced by MPs, parliamentary groups and committees. In order to identify parliamentary interventions representing demands for policy evaluation we performed a keyword searchFootnote 5 on their title and full text. Following this procedure, 271 parliamentary interventions were identified and read in their entirety by one of the authors. This coder identified 20 “false positives” (i.e., presence of the keywords but no actual reference to policy evaluations).
The following analysis will model the reported submission of parliamentary interventions with a two-step model. First, MPs have to participate in the survey before they can (mis)report about their parliamentary interventions on policy evaluation. Some variables may affect both survey participation and misreporting. Moreover, the sample could be biased by self-selection and unobservable factors such as memory failure or social desirability. Thus, a Heckman (Reference Heckman1979) model is estimated in order to correct for selection. If the error terms of both equations are correlated (for survey participation and over- and underreporting), then the second equation has to be biased (over- and underreporting).
Dubin and Rivers (Reference Dubin and Rivers1989) as well as Sartori (Reference Sartori2003) have adapted Heckman’s model for binary dependent variables. The equation for the auxiliary latent variables $y_{{1i}}^{{\asterisk}} $
is
$y_{{1i}}^{{\asterisk}} $
is
 $$y_{{1i}}^{{\asterisk}} \,{\equals}\,\beta ^{\prime} _{1} x_{{1i}} {\plus}{\epsilon}_{{1i}} ,$$
where $y_{{1i}}^{{\asterisk}} $
is the underlying probability to participate in the survey of an individual i with their explanatory variables x
1i
and the error term ϵ
1i
. In a situation with non-random selection, the equations for the selection models are
$y_{{1i}}^{{\asterisk}} $
is the underlying probability to participate in the survey of an individual i with their explanatory variables x
1i
and the error term ϵ
1i
. In a situation with non-random selection, the equations for the selection models are
 $$y_{{1i}} \,{\equals}\,\left\{ {\matrix{ {0\,{\rm if}\,y_{{1i}}^{{\asterisk}} \,\lt\,0} \cr {1\,{\rm if}\,y_{{1i}}^{{\asterisk}} \geq 0}, \cr } } \right.$$
 $$y_{{2i}} \,{\equals}\,\left\{ {\matrix{ {0\,{\rm if}\,y_{{2i}}^{{\asterisk}} \,\lt\,0} \cr {1\,{\rm if}\,y_{{2i}}^{{\asterisk}} \geq 0}, \cr } } \right.$$
where y 1i is the observed dependent variable for survey participation and y 2i the dependent variable for over- or underreporting. The Heckman model estimates the likelihood to misreporting and takes the probability of the survey participation into account.
In order to analyze MPs’ survey participation, we include several variables. Based on the leverage-salience theory, we assume that MPs that have actually submitted a parliamentary intervention to demand policy evaluation are more likely to participate in the survey than the other MPs, since this attribute may have great leverage on the survey participation. In addition, we include several variables that might influence the survey participation of a parliamentarian (gender, age, language and parliamentary group).Footnote 6 The models that analyze the over- and underreporting will include legislative professionalism and MPs’ attitude toward evaluations. First, the degree of professionalization is an important MPs’ attribute (Squire Reference Squire1992; Squire Reference Squire2007). Since the membership in the Federal Assembly is only a secondary appointment, the amount of time for the parliamentary mandate differs significantly among the parliamentarians (Kriesi Reference Kriesi2001; Bailer Reference Bailer2011).Footnote 7 Second, the MPs’ attitude toward evaluations can influence the over- and underreporting of an evaluation demand, since the attitude toward evaluations plays an important role when dealing with evaluations (Johnson et al. Reference Johnson, Greenseid, Toal, King, Lawrenz and Volkov2009).
Subsequently, an analysis of the MP’s likelihood to demand an evaluation is reconstructed from Bundi (Reference Bütikofer2016) in order to demonstrate the bias effects of the survey. In doing so, several variables that may influence the parliamentary demand for evaluations are included in the model (gender, age, bureaucratic drift, professionalization, attitude toward evaluations, parliament experience, membership in an oversight committee and membership in the parliament board).Footnote 8
Results
Representativeness of the Survey
A survey sample does not only rely on a reasonable response rate, but also on whether it represents the object of investigation. In order to control for such a self-selection bias, we have compared the participants of the survey with all invited MPs regarding different characteristics.
The four parties Swiss People’s Party, Social Democratic Party, FDP.The Liberals and Christian Democratic People’s Party combine the most MPs in the parliament and are reasonably represented in the survey (80.4 percent in the survey to 80.8 percent in the parliament). The two pole parties are responsible for the highest deviation: while party members of the Swiss People’s Party are underrepresented, the MPs of the Social Democratic Party are overrepresented. Concerning the gender, the sample is relatively balanced, even if more female MPs participated than their male colleagues. The same is true for the language of the MPs, as German-speaking MPs are slightly underrepresented (68.8–72.2 percent). Moreover, the participated MPs do not vary strongly from the invited MPs regarding their age. Although we observe that younger and older MPs participated more often than their middle-aged colleagues from 50 to 64 years. As a consequence, MPs with a parliament seniority between eight and 11 years are underrepresented in the survey sample (13.4–18.0 percent). In contrast, almost no differences can be observed regarding the committee memberships and the number of parliamentary interventions, which were submitted by the MPs. Hence, we conclude that the survey sample overall represents the investigated parliament quite well.Footnote 9
Self-Selection and Misreporting Bias of the Survey
The self-selection bias is measured with a comparison between the validated evaluation demand of survey participants and non-participants. Table 1 shows that the participants and non-participants do not differ systematically in their demand for evaluations. A majority of both groups (about 66 percent) have indicated that they have never submitted a parliamentary intervention in order to demand an evaluation. Moreover, the share of MPs that have submitted an evaluation demand several times is slightly higher among the survey non-participants than the participants (15.8–13.4 percent). MPs that have submitted an evaluation demand did not participate in the survey more frequently. Thus, the data suggests with an overall self-selection bias of 1.4 percent that there is no systematic self-selection bias in the survey sample.
Table 1 Self-Selection Bias: Validated Data of the Parliamentary Demand for Evaluations (Frequency)
Note: The total self-selection bias within each column is estimated by the difference between the participations and the non-participations of the survey. The overall self-selection bias is estimated by the addition of all self-selection biases and is weighted for the number of members of parliaments (MPs). Usually, the Swiss Federal Assembly consists of 246 MPs (200 lower chamber and 46 upper chamber). However, during the time of the survey, a seat in the upper chamber was vacant (Eberli et al. Reference Eberli, Bundi, Frey and Widmer2014).
In order to estimate the misreporting bias, we compare the reported data with the validated data of the survey participants (Table 2).Footnote 10 According to the survey, 22.7 percent of MPs have reported that they have submitted a parliamentary intervention demanding an evaluation once, while 33.0 percent reported to have done it several times. Here the reported data differs significantly from the validated data. Although the percentage of MPs who submitted a parliamentary intervention once is roughly equivalent, 33.0 percent of MPs have reported to demand an evaluation several times, but only 13.4 percent actually did. In addition, fewer MPs reported to have demanded an evaluation (44.3 versus 68.0 percent). Since the overall misreporting bias is 18.7 percent, we conclude that there is a misreporting bias in the survey sample.
Table 2 Misreporting Bias: Difference Between Validated and Reported Data of the Parliamentary Demand for Evaluations of the Survey Participants (Frequency)
Note: The total misreporting bias within each column is estimated by the difference between the participations and the non-participations of the survey. The overall misreporting bias is estimated by the addition of all misreporting bias and is weighted for the number of members of parliaments.
Albeit the reported data clearly shows a misreporting bias, it is not clear whether the MPs have over- or underreported. Table 3 shows the comparison between the reported and the validated data at the individual level. In all, 45.4 percent of MPs have given a consistent answer in the survey. Those MPs have reported their accurate behavior. In contrast, about the same share of MPs have overreported (41.3 percent), which means that have reported to submit more demands for evaluations than they have actually done. Finally, the share of MPs that have underreported is relatively high (13.4 percent).Footnote 11 Those MPs have neglected or reported fewer demands for evaluations than they have actually submitted.
Table 3 Misreporting Bias: Overview of Over- and Underreporting (Frequency)
Note: 45.4 percent of the members of parliaments (MPs) have given a consistent response, 41.3 percent have over- and 13.4 percent have underreported. The percentages are estimated by adding the numbers of MP with the respective response.
Misreporting: What Factors Explain Over- and Underreporting?
As a next step, we will try to identify which determinants influence participation in the survey, as well as over- und underreporting in the survey. Table 4 presents the findings of the separate probit models for survey participation, over- and underreporting, as well as the findings of the Heckman selection models. Model 1 illustrates the probit model to participate in the survey.
Table 4 Determinants of Survey Participation, Over- and Underreporting (Separate Models and Heckman Models)
Note: Regression coefficients shown with robust standard biases in parentheses; Reference category for Latin: German; reference category for center and left parties: right parties.
We have also estimated models with the time that has passed between a parliamentary intervention and the survey in order to account for possible memory failures. This variable has no significant effect (p-value>0.7). However, this variable would have had substantially decreased the number of observations, since we can only estimate this variable for those members of parliaments who submitted an intervention and participated in the survey (n=38). For this reason, we have decided to omit the time variable.
LR=likelihood ratio.
*p<0.1, **p<0.05, ***p<0.01.
According to the model, the likelihood of MPs of left parties to participate in the survey is slightly significantlyFootnote 12 higher. This result is evident, since we have a slightly higher participation of left parties in the survey (Table A2). Since significance disappears for left parties in model 5, we have to assume that the effect is not robust. Hence, models 1 and 5 support the conclusion that the sample is not biased by self-selection.
Regarding the misreporting of MPs, both in terms of over- and underreporting, the models show different results. Model 2 shows that MPs with a highly positive attitude toward evaluations have a 53 percentFootnote 13 higher probability to overreport than those parliamentarians with a negative attitude (Figure 2). Not surprisingly, MPs that have submitted a parliamentary intervention to demand an evaluation have a lower probability to overreport—since they cannot overreport when they have truly performed the action in question.
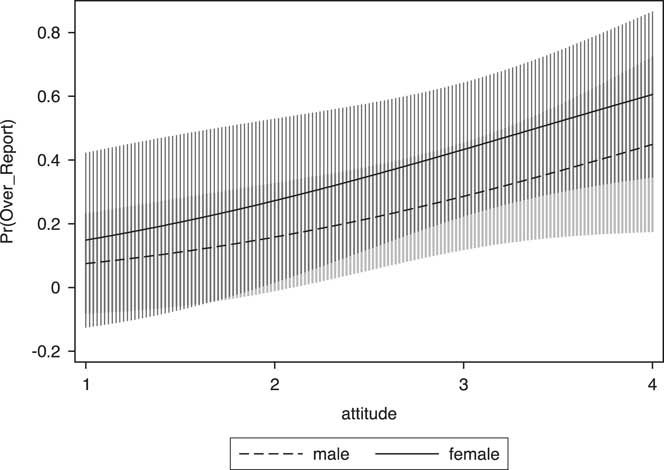
Fig. 2 Predicted probability of survey overreporting for the attitude toward evaluation and the gender Note: The scale of the attitude toward evaluations ranges from 1 (negative) to 4 (positive). Reference categories: German, center party, mean age, mean professionalization and evaluation demand.
The results for underreporting are contrasting (model 3). The more negative the attitude toward evaluations, the higher the MPs’ likelihood to underreport. In addition, women tend to underreport less than their male colleagues (Figure 3). However, the gender effect dissolves with a positive attitude toward evaluations. Evidence from other domains is ambiguous: whereas research in epidemiology shows conform findings that women are less prone to social desirability effects (Hebert et al. Reference Hebert, Ma, Clemow, Ockene, Saperia, Stanek, Merriam and Ockene1997; Ambwani and Chmielewski Reference Ambwani and Chmielewski2013), literature from business studies presents opposite or inconclusive results (Chung and Monroe Reference Chung and Monroe2003; Murphy Reference Murphy2012). A convincing theoretical explanation is missing, which explains why women with a negative attitude toward evaluations underreport less than men. Since female MPs are overall younger, have a shorter experience in parliament, are less established politicians, and belong more often to the French speaking and to the left-wing parties than their male colleagues, a spurious correlation seems to be the most obvious explanation for this finding. Furthermore, the submission of a parliamentary intervention has a highly significant influence on the likelihood to underreport. This is again not surprising, since submitting an intervention is a precondition for underreporting.
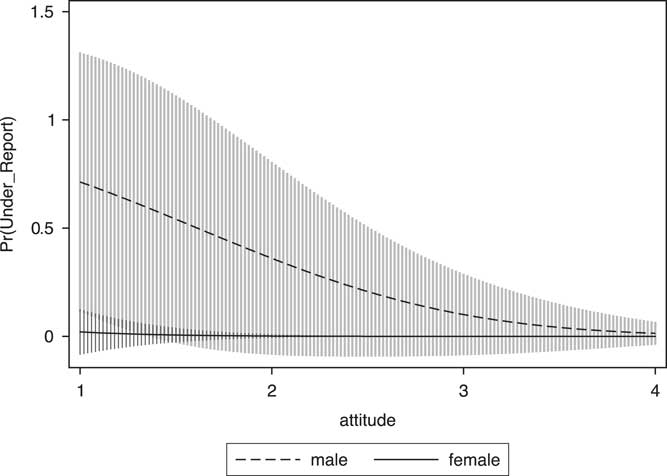
Fig. 3 Predicted probabilities of survey underreporting for the attitude toward evaluation and the gender
The Heckman models 4 and 5 show similar results. This means that omitting for the survey participation does not lead to an inconsistent estimation for over- and underreporting. Since the likelihood ratio tests of the independent equations are not significant, we do not have to control for selection.
The Effects of Self-Selection and Misreporting
Finally, we will reconstruct the analysis of Bundi (Reference Bütikofer2016) that investigates the determinants for the MPs’ demand for evaluations (Table 5). In doing so, we compare the findings for the reported evaluation demand (model 6) and the validated evaluation demand (model 7). The table shows that almost all effects decrease with some exceptions. Female MPs have a significant higher propensity to report an evaluation demand, however, this effect disappears on the validated demand for policy evaluation.
Table 5 Determinates for Reported and Validated Evaluation Demand
Note: Regression coefficients shown with robust standard biases in parentheses.
*p<0.1, **p<0.05, ***p<0.01.
The model shows that the attitude toward evaluation has a highly significant influence on whether a MP reports an evaluation demand (Figure 4). However, the attitude and the gender have no influence on the actual behavior. MPs with a negative attitude toward evaluations do not significantly demand fewer evaluations than those MPs with a positive attitude (Figure 5). Since model 6 estimation overperforms model 7 clearly, we can conclude that common explanatory variables are better in explaining evaluation demand reporting than actual evaluation demand.
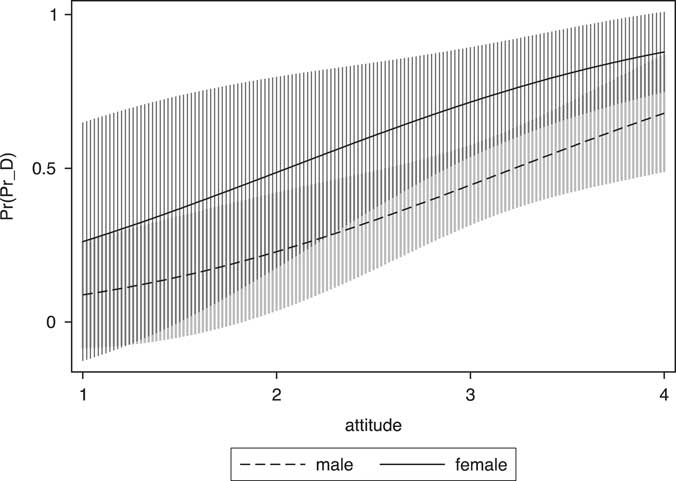
Fig. 4 Predicted probabilities of reported evaluation demand for the attitude toward evaluations and the gender Note: Reference categories: mean age, mean bureaucratic drift, mean professionalization, mean parliament seniority, oversight committee member, parliament board member.
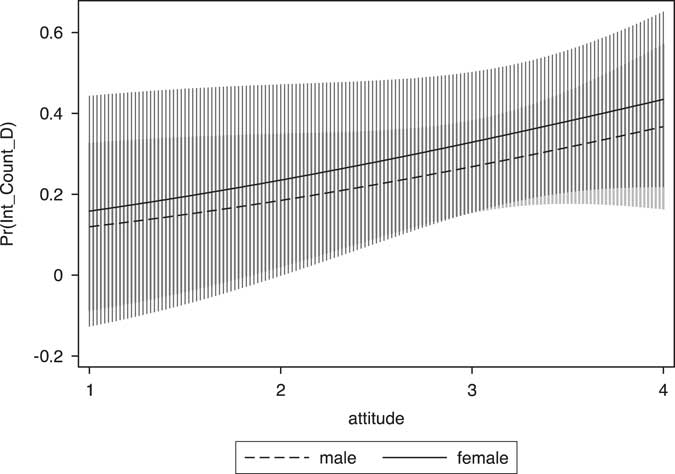
Fig. 5 Predicted probabilities of validated evaluation demand for the attitude toward evaluations and the gender Note: Reference categories: mean age, mean bureaucratic drift, mean professionalization, mean parliament seniority, oversight committee member, parliament board member.
Discussion: Is the Attitude the Key to Explain Misreporting?
The analysis shows that the attitude toward the object, in our case the evaluation, has an influence on the survey results. Since the MPs’ attitude toward evaluations influences overreporting in a positive and underreporting in negative way, the overall analysis is biased. The question is why attitude has such an influence on misreporting and how we can deal with this instance. It is often argued in literature that social desirability and memory failure are the reason for misreporting. How are these concepts linked to the attitude toward the object of research?
According to Krumpal (Reference Krumpal2013, 2018), social desirability refers to the tendency of the respondents to agree to socially desirable attitudes. Either social desirability appears when a respondent refers to a characteristic to receive approval of somebody (interviewee, peers, general public, etc.) or when a survey item is especially susceptible to give socially desirable answers. Even though evaluation is not a particularly sensitive topic, the attitude toward it can nevertheless influence the survey responses. We argue that the attitude interacts with social desirability and memory failure. A person with a more positive attitude will more likely feel the pressure to overreport due to social desirability. In contrast, the effect for a person with a more negative attitude goes in the opposite direction, since the person cares less about the objective and is more susceptible to memory failures. Therefore, the person will less likely overreport, in fact even underreport due to the circumstance that he or she may underestimate his or her activity, due to a lack of memory. As a consequence, a negative attitude can theoretically influence memory failure.
To sum up, we argue that scholars have to pay attention to the attitude toward the object of a survey, since the attitude may influence the reporting of this activity. A positive attitude interacts with social desirability and fosters overreporting, while a negative attitude has an influence on memory failure and leads to underreporting.
Conclusion
In this article, we have reviewed the methodological challenges of legislative surveys, namely sampling, participation, response and misreporting biases (Traugott and Katosh Reference Traugott and Katosh1979; Belli et al. Reference Belli, Traugott, Young and McGonagle1999; Groves et al. Reference Groves, Dillman, Eltinge and Little2002; Ansolabehere and Hersh Reference Ansolabehere and Hersh2012). In particular, we have focused on the self-selection and misreporting biases as they represent crucial issues for legislative surveys. The aim of this study was to measure empirically the scope of both biases, their antecedents and their effects on the validity of legislative survey responses. In order to study survey biases in a legislative context, the article compared the MPs’ responses to a survey with their actual behavior in the parliament. The results indicate that survey responses are indeed biased. While self-selection does not seem to be a major problem in legislative surveys, misreporting is of a greater relevance. The attitude toward the object of a survey can highly influence the MPs’ responses on this object. In our empirical illustration based on MPs’ demands for policy evaluations, MPs with a more positive attitude toward evaluations have overreported, while MPs with a more negative attitude have underreported. We conclude that scholars should be careful when interpreting survey results, since the attitude is strongly linked to social desirability.
This study has some limitations. First, the number of observations is rather small to obtain robust results. Although our data set provides a full sample of all Swiss MPs at the federal level, the number of studied MPs should ideally be increased to produce more reliable findings. Second, our data set suggests that one can rather focus on the misreporting bias then on the self-selection bias. Albeit this makes it easier for the survey researcher to concentrate on a specific methodological problem, the data also shows that the underreporting percentage is much higher compared with other types of surveys, such as postelection or household panel surveys. Thus, scholars relying on legislative surveys have to deal not only with overreporting, but also with underreporting. Underreporting is a well-known challenge in elite surveys, in particular when the respondents have rather a high status among the participants (Fowler et al. Reference Fowler2011, 456) or the answer is sensitive (Corstange Reference Corstange2009, 45). In the case of our empirical illustration, MPs may have underreported as a result of different understandings of the object of the survey (e.g., “evaluation”). Despite the fact that we provided an explicit definition for “evaluation” in the questionnaire to reduce this problem, we cannot entirely exclude that MPs may have responded with a different definition of the concept in mind. Last, the attitude toward an object cannot only influence responses on the object itself, but also the participation. However, we cannot empirically analyze this question, since we lack information on the attitude of the MPs that did not participate in the survey. A possibility for further application would be to estimate the attitude toward evaluations, with the limitations that some MPs might have no attitude at all.
This article has made an important contribution to understand how methodological issues can influence the results of a legislative survey. In legislative research, literature indicates that the role of legislatives may increase in the future and will be more studied (Beichelt Reference Beichelt2012; Winzen Reference Winzen2013; Russel, Gover and Wollter Reference Russell, Gover and Wollter2015). Since the number of legislative surveys will most likely increase as a consequence, scholars should pay attention to the validity of survey results. In this regard, our article is a helpful starting point in the study of the methodological challenges of legislative surveys. While our analyses provide limited conclusions regarding social desirability and memory failure, we hope to stimulate more studies digging deeper into the phenomenon of MPs’ misreporting.
Appendix
Table A1 Operationalization of the Variables
Table A2 General Self-Selection Bias